Download presentation
Presentation is loading. Please wait.

1
Northern Ireland Demographic Projections 2 nd December 2008 Dr David Marshall Demography and Methodology Branch

2
Users / Introduction / Process Demographic Assumptions 2006 Based NI and local Results Household Projections (NI level) User Views
 User Views")
3
Children - Users Education - School Planning - 1960s baby-boom Health - Maternity Units – rationalisation NI Local Dimension

4
Working Age - Users Labour Market (migration limits) Housing & Transport (planning) Diversity of the Population [RG Annual Report 2007 – Tony Dignan]
![Working Age - Users Labour Market (migration limits) Housing & Transport (planning) Diversity of the Population [RG Annual Report 2007 – Tony Dignan]](http://images.slideplayer.com/19/5888926/slides/slide_4.jpg "Working Age - Users Labour Market (migration limits) Housing & Transport (planning) Diversity of the Population [RG Annual Report 2007 – Tony Dignan]")
5
Elderly – Users Mortality projections Health Services demand Nursing / Residential Care Pension Policy (pension age)
")
6
Introduction Projections every other year (2006 based) Top Down Approach (UK-based) –NI, England, Scotland, Wales population projections –Government Actuary, ONS The Principal Projection (principal scenario) Variant Projections (alternative scenarios) Then local projections (26 Councils) - NISRA
 Top Down Approach (UK-based) –NI, England, Scotland, Wales population projections –Government Actuary, ONS The Principal Projection (principal scenario) Variant Projections (alternative scenarios) Then local projections (26 Councils) - NISRA")
7
Introduction Single year of age up to 90 years Time-period 75 years (2081 - NI) and 15 years (2021 - Local) Special populations (students, armed forced) Demographic assumptions based on trend No direct account of economic changes (NOT FORECASTS !)
 and 15 years ( Local) Special populations (students, armed forced) Demographic assumptions based on trend No direct account of economic changes (NOT FORECASTS !)")
8
NI Cohort Component Accounting Formula 2006 Mid-Year Estimate + Births - Deaths + Net Migration “Age on Population” = 2007 Projected Population Fertility Mortality Migration

9
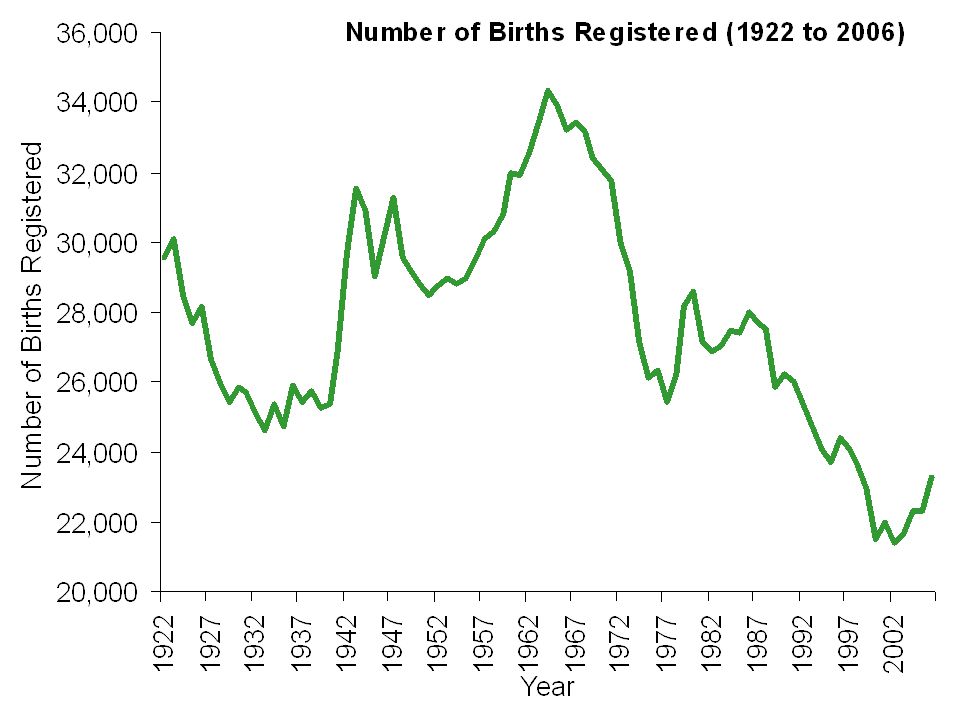
NI Fertility Assumptions (2006-Based)
")
11
Replacement Rate

12
Changing demographic times - Fertility -27,500 births in 1988 -24,500 births in 2007 -Birth rate of average female 1988: 2.35 children 2007: 2.01 children -Older mums – delayed fertility – catch-up

13
Fertility: Long- term TFR assumption UKNI Eng.WalesScot 2006-based1.841.85 1.651.95 Republic of Ireland – 1.90

14
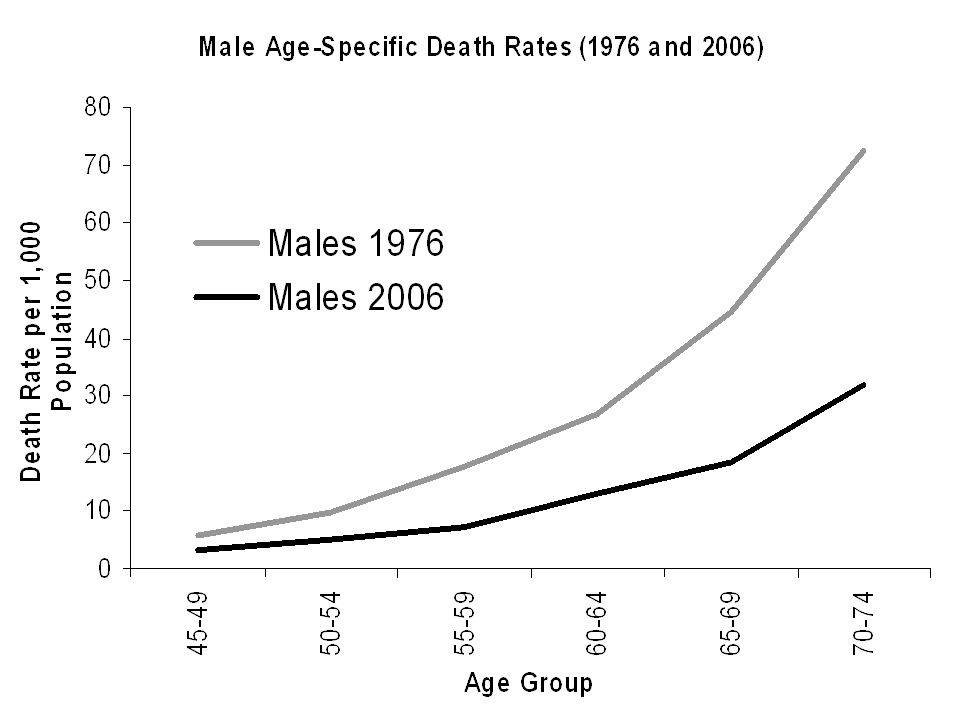
NI Mortality Assumptions (2006 Based)
")
17
Changing demographic times - Mortality -long term drop in death rate -c50% fall in death rate since mid 1970s -“Ageing population” -“Golden cohort” born in 1930s -Similar across developed world -Conservatism of actuarial profession -Age mortality rates: 1% per annum fall

19
Long term rates of improvement in age-specific mortality rates: 1% per annum Expectation of life at birth in 2031UKEng.WalesScotNI Males 82.783.082.480.482.2 Females 86.286.486.084.886.1

20
NI Migration Assumptions (2006-Based)
")
21
Population Gain Population Loss Worst of “The Troubles” EU Expansion Ceasefires

22
Changing demographic times - Migration Migration increasingly important (Eastern Europe – A8, Portugal etc … ) Extensive 2005/6 research on migration Migration difficult to measure - no direct measure & illegal migration - limited “ proxy ” data sources - population change = (In – Out)
 Extensive 2005/6 research on migration Migration difficult to measure - no direct measure & illegal migration - limited proxy data sources - population change = (In – Out)")
23
–“The Troubles” / EU Expansion –Long-term - 10 year average –Short-term - A8 migration to 2012 –NI net migration assumptions 2006-2012 (+20,000 people) 2012 onwards (+500 per annum) –RoI long term net migration assumptions (+2,000 or +6,000 per annum)
 2012 onwards (+500 per annum) –RoI long term net migration assumptions (+2,000 or +6,000 per annum)")
24
Principal Population Projections Results - Northern Ireland

25
NI Headline Results +70,000 persons growth between 2006-11 –Natural growth 51k –Net migration 19k +110,000 persons growth between 2011-21 –Virtually all natural growth (2006-21) children constant working age +5% pensioners +40% (65+ males and 60+ females)
 children constant working age +5% pensioners +40% (65+ males and 60+ females)")
26
NI Population 1971-2031

27
NI Population, 1971-2031 (Age-distribution)
")
28
Animated Population Pyramid

29
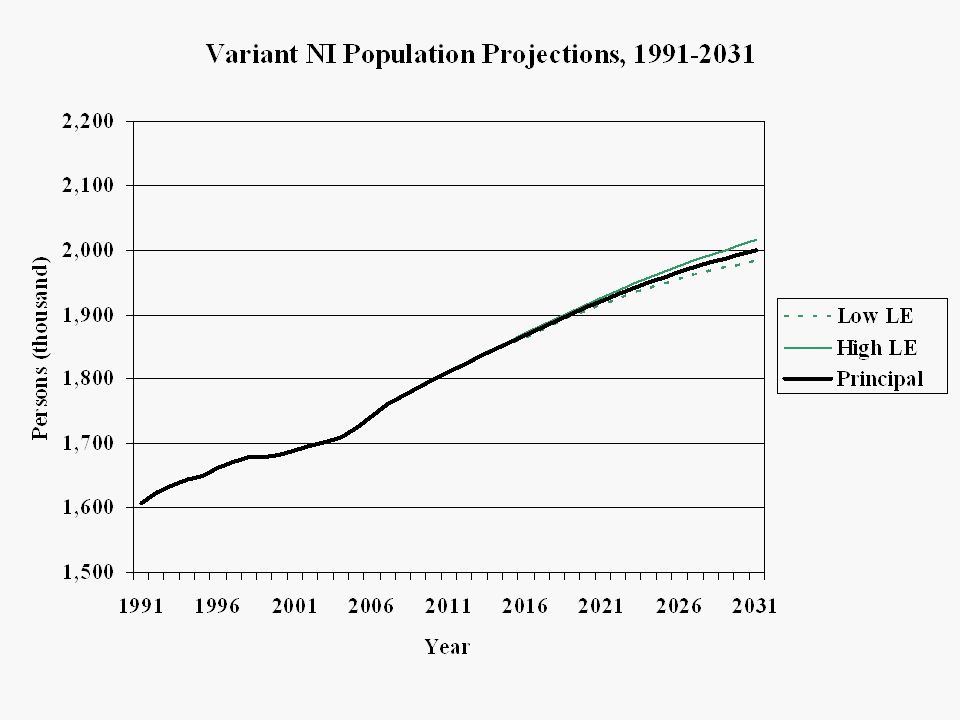
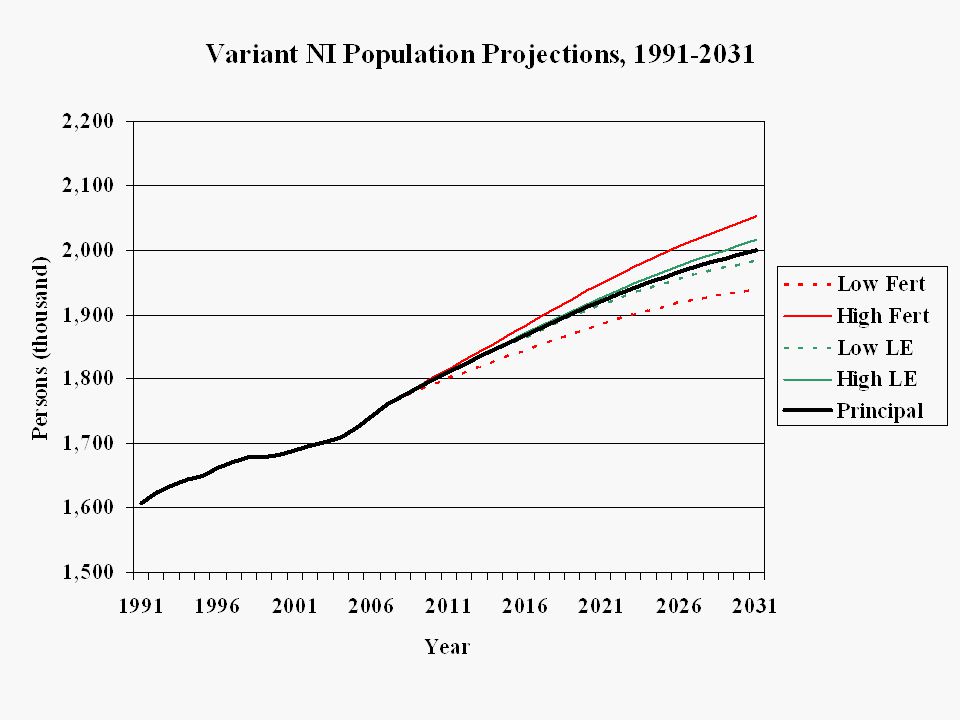
Variant Population Projections Northern Ireland

30
Variant Projections Uncertainty - variant projections ‘Single component’ variants (high/low) ‘Combination’ variants Special case (zero migration etc..) 20 variants in total (www.gad.gov.uk)www.gad.gov.uk
 ‘Combination’ variants Special case (zero migration etc..) 20 variants in total (")
31
High / Low Variants High variant PrincipalLow Variant Fertility (TFR)2.151.951.75 Mortality: Males (2031 EoL) 84.282.280.2 Mortality: Females (2031 EoL) 87.386.184.8 Net Migration (per annum) 5,000500-4,000
 Mortality: Males (2031 EoL) Mortality: Females (2031 EoL) Net Migration (per annum) 5, ,000")
35
Population Projections Sub-Northern Ireland

36
Introduction Local projections (26 Councils) Principal Projection only Up to 2021 Constrained to NI projection (births, deaths, migration)
 Principal Projection only Up to 2021 Constrained to NI projection (births, deaths, migration)")
37
Historical DataProjected Data

38
Historical DataProjected Data

39
Local Migration Distribute NI level migration flows to areas (average over last 4 years) ALSO Within NI migration (40,000 people per annum move between LGDs: average over last 4 years) Special Populations (Students & Forces)
 ALSO Within NI migration (40,000 people per annum move between LGDs: average over last 4 years) Special Populations (Students & Forces)")
40
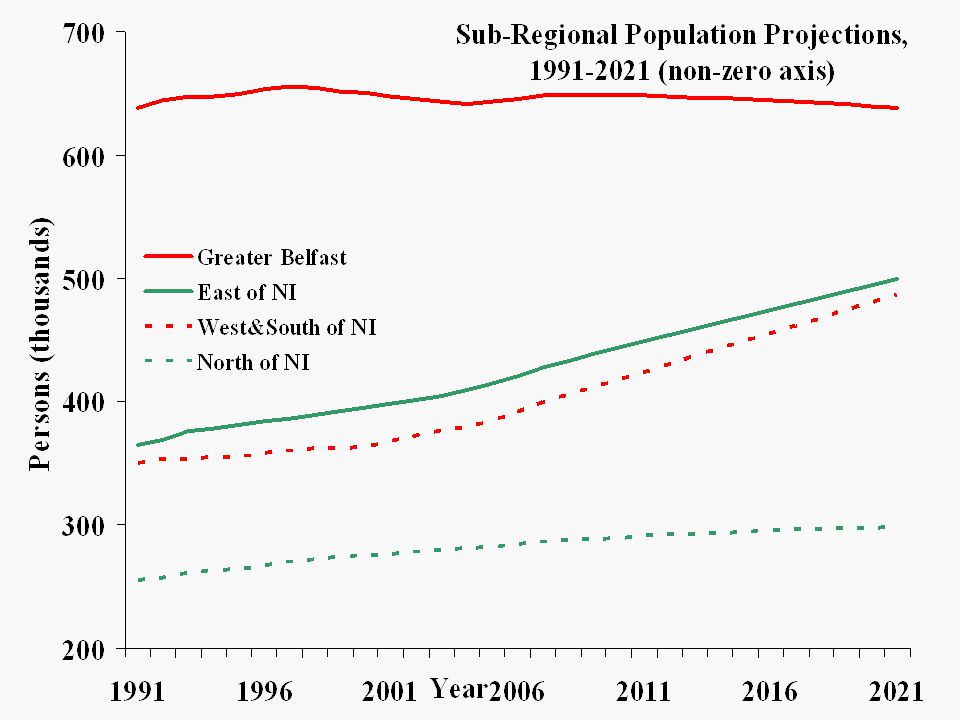
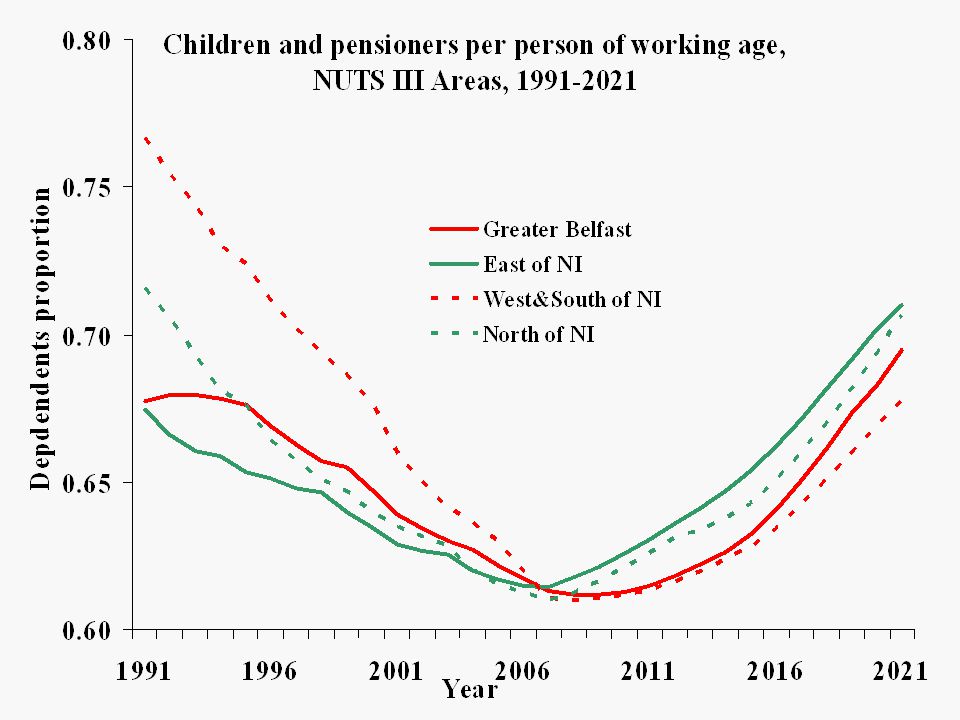
NUTS III Areas in Northern Ireland

43
Northern Ireland Percentage Change

44
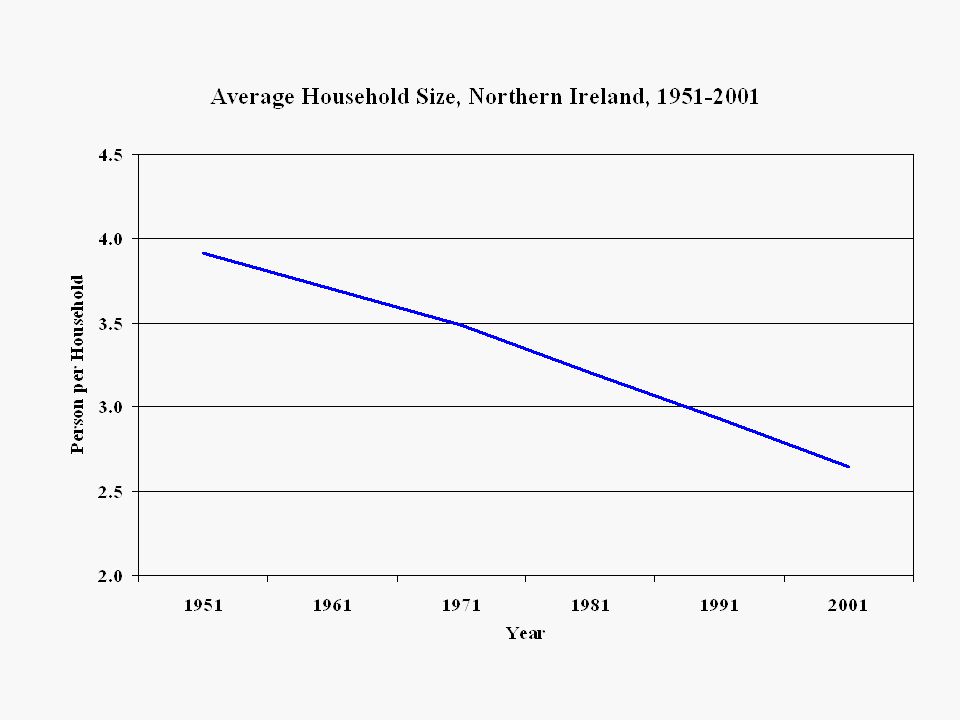
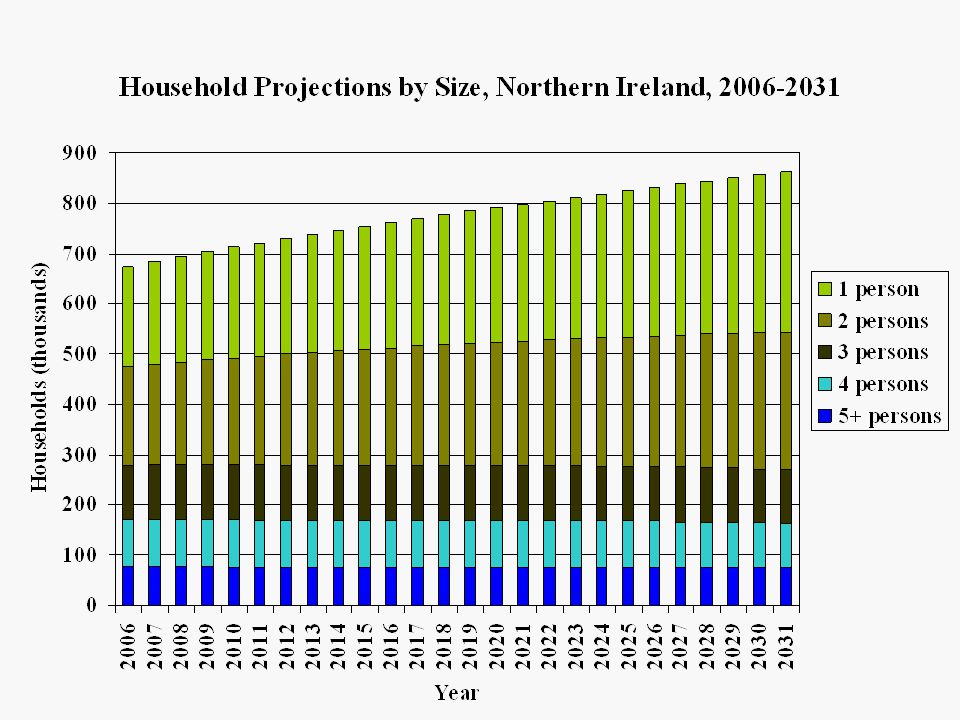
Northern Ireland Household Projections

46
Households by Size, 1951 and 2001

47
Population Projections 1991 Census Household Projections Mid-Year Population Estimates Fertility, mortality and migration assumptions Registered Births Registered Deaths Estimated Migration 2001 Census Schematic Projection Process Household formation assumptions Other Sources

48
Methodology Probabilities for membership of household types for each age-sex group Constant age-sex probability of being in a communal establishment Household projections up to 2031 (NI level) Local Household Projections up to 2021 (Local Level)
 Local Household Projections up to 2021 (Local Level)")
50
Larger increase in households than population

52
User Views -Interested in user views -Alternative scenarios? -Other projections (e.g. health status)? -Any other issues? -Questionnaire
. -Any other issues. -Questionnaire.")
53
: www.gad.gov.uk : www.nisra.gov.uk : census.nisra@dfpni.gov.uk : 028 90348160www.gad.gov.ukwww.nisra.gov.ukcensus.nisra@dfpni.gov.uk

54
Northern Ireland Demographic Projections 2 nd December 2008 Dr David Marshall Demography and Methodology Branch

Similar presentations


. Presentation Outline Background Methodology Wales Results Household Estimates HOUSEGROUP WALES.>")


