Download presentation
Presentation is loading. Please wait.

1
Equity and the International Climate Regime Sivan Kartha Stockholm Environment Institute TELI-G 2015 January 16, 2015

2
IPCC, AR5: “We can do it.” 2 IPCC AR5 WGIII, SPM, Figure SPM 4 > 100 techno-economic scenarios illustrating low emissions development paths (blue range) that keep warming likely to remain below 2°c. ~3°C ~4-5°C

3
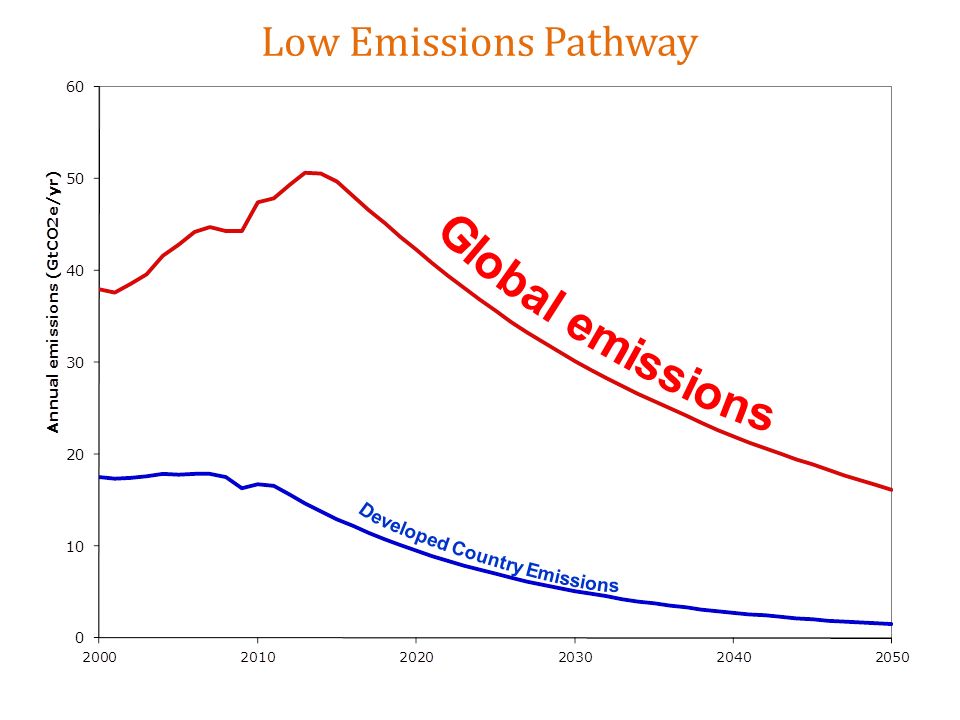
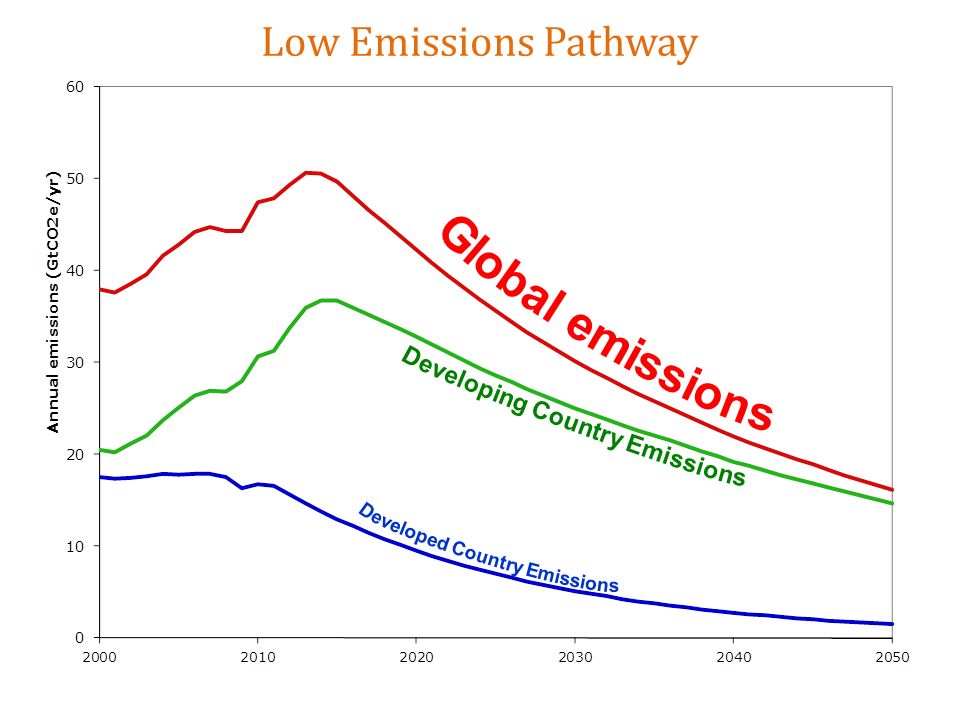
Low Emissions Pathway

7
7 Climate challenge … in the midst of a development crisis? Nearly 2 million per year die from lung diseases due to cooking smoke About 800 million people chronically undernourished More than 1 billion have poor access to fresh water 2 million children die per year from diarrhea 30,000 deaths each day from preventable diseases 3 billion people without access to clean cooking fuel, electricity, or both

8
When do emissions have to peak and start falling? No. America/W. Eur AsiaLatin America Middle East/Africa Economies Japan/Aus/New Z in Transition Emissions peak, globally and in all regions, in next ~10 years in the “likely 2°C” category of paths. → Broad low-GHG transformation underway in all regions. 8 IPCC AR5 WGIII, Ch. 6 Figure 6.7

9
Income in year that emissions peak Sources: World Development Indicators Databank (World Bank, May2013); Incomes in PPP US$
; Incomes in PPP US$")
10
Income in year that emissions peak Sources: World Development Indicators Databank (World Bank, May2013); Incomes in PPP US$
; Incomes in PPP US$")
11
How is mitigation effort globally distributed? Expressed as costs (% of GDP) OECD: mitigation expenditures are lowest Latin America: 2x higher Asia: 3x higher Mid. East/Africa, EITs: 4-5x higher IPCC AR5 WGIII, Fig. 6.27 This is how costs would be distributed if each country had to bear its own mitigation costs.
 OECD: mitigation expenditures are lowest Latin America: 2x higher Asia: 3x higher Mid. East/Africa, EITs: 4-5x higher IPCC AR5 WGIII, Fig This is how costs would be distributed if each country had to bear its own mitigation costs..")
12
No single country can protect “its own” climate by reducing its own emissions No country can solve its own climate problem for itself. Countries must persuade other countries to help it solve its climate problem A country thus reduces its own emissions – and cooperates in other ways – for the sake of inducing reciprocal effort, i.e., getting other countries to do likewise. A country is more likely to be successful if it is perceived as doing its fair share of the effort. So, international cooperation with equitable effort-sharing is more likely to be agreed and successfully implemented. “Outcomes seen as equitable can lead to more effective cooperation.” [IPCC, Summary for Policy Makers, 2014] Why a global climate response must be fair to be effective:

13
“The Parties should protect the climate system for the benefit of present and future generations of humankind, on the basis of equity and in accordance with their common but differentiated responsibilities and respective capabilities.” Principles, Article 3.1, UNFCCC, 1992 13

14
Principle 7, Rio Declaration, 1992 “In view of the different contributions to global environmental degradation, States have common but differentiated responsibilities. The developed countries acknowledge the responsibility that they bear in the international pursuit of sustainable development in view of the pressures their societies place on the global environment and of the technologies and financial resources they command.” 14

15
15 “Countries will be asked to meet different requirements based upon their historical share or contribution to the problem and their relative ability to carry the burden of change. This precedent is well established in international law, and there is no other way to do it.” Al Gore

16
16 Income and Capacity

17
17 A “development threshold” ? What should a “Right to Development” safeguard? Traditional poverty line: $1/day? …$2/day? (“destitution line” and “extreme poverty line” of World Bank, UNDP, etc. ) Empirical analysis: $16/day (“global poverty line,” after Pritchett/World Bank (2006)) For indicative calculations, consider development threshold 25% above global poverty line about $20/day ($7,500/yr; PPP-adjusted)
 Empirical analysis: $16/day ( global poverty line, after Pritchett/World Bank (2006)) For indicative calculations, consider development threshold 25% above global poverty line about $20/day ($7,500/yr; PPP-adjusted).")
18
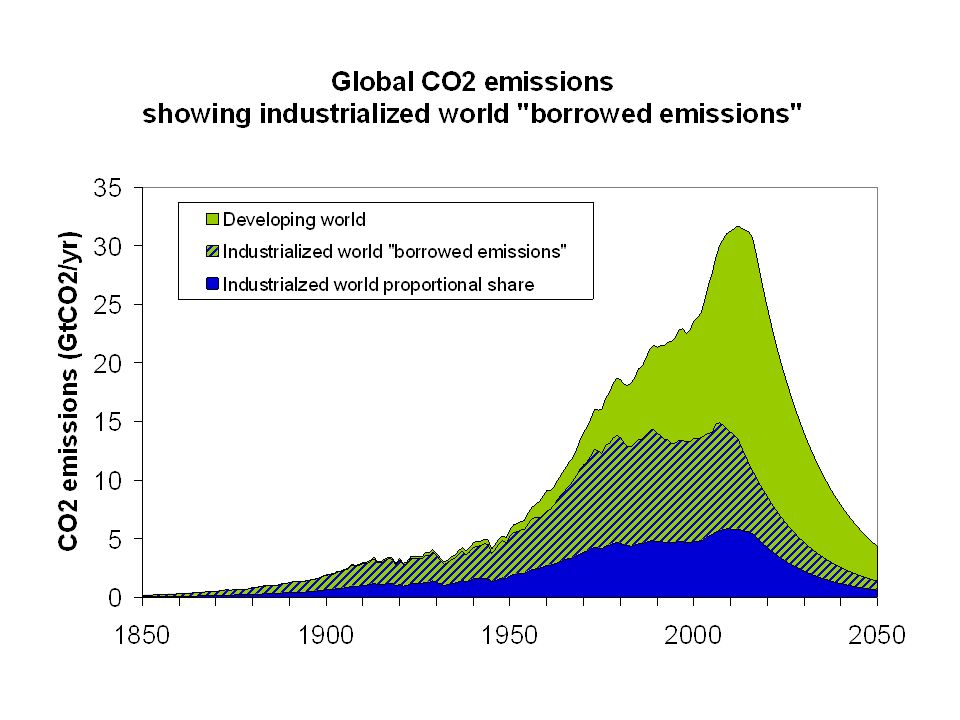
Emissions and Responsibility fossil CO 2 (cumulative since 1990 showing portion defined as “responsibility”) 18
 18")
19
Settings: Since 1850 (High), since 1950 (Medium), or since 1990 (Low) Historical emissions and responsibility 19 1850 19501990
, since 1950 (Medium), or since 1990 (Low) Historical emissions and responsibility")
20
Population % Income ($/capita) Capacity % Responsibility % RCI (obligations) % EU 27 7.3 30,47228.8 22.625.7 - EU 15 5.8 33,75426.1 19.822.9 - EU +12 1.5 17,708 2.7 2.8 2.7 Norway 0.0752,406 0.54 0.26 0.40 United States 4.5 45,64029.7 36.433.1 China19.7 5,899 5.8 5.2 5.5 India17.2 2,818 0.66 0.30 0.48 South Africa 0.7 10,117 0.6 1.3 1.0 LDCs11.7 1,274 0.11 0.04 0.07 Annex I18.7 30,92475.8 78.076.9 Non-Annex I81.3 5,09624.2 22.023.1 High Income15.5 36,48876.9 77.977.4 Middle Income63.3 6,22622.9 21.922.4 Low Income21.2 1,599 0.2 World100% 9,929 100 % 20 National fair share of the effort based on national “capacity” and “responsibility”
 Capacity % Responsibility % RCI (obligations) % EU , EU , EU , Norway , United States , China19.7 5, India17.2 2, South Africa , LDCs11.7 1, Annex I , Non-Annex I81.3 5, High Income , Middle Income63.3 6, Low Income21.2 1, World100% 9, % 20 National fair share of the effort based on national capacity and responsibility")
21
National fair share of the effort based on capacity and responsibility 201020202030 Population (% of global) GDP per capita ($US PPP) Capacity (% of global) Responsibility (% of global) RCI (% of global) RCI (% of global) RCI (% of global) EU 27 7.330,47228.822.625.722.919.6 - EU 15 5.833,75426.119.822.919.916.7 - EU +12 1.517,708 2.7 2.8 2.7 3.0 Switzerland0.1139,181 0.60 0.27 0.44 0.37 0.30 United states 4.545,64029.736.433.129.125.5 Japan 1.933,422 8.3 7.3 7.8 6.6 5.5 Russia 2.015,031 2.7 4.9 3.8 4.3 4.6 China19.7 5,899 5.8 5.2 5.510.415.2 India17.2 2,818 0.66 0.30 0.5 1.2 2.3 South Africa 0.710,117 0.6 1.3 1.0 1.1 1.2 Mexico 1.612,408 1.8 1.4 1.6 1.5 LDCs11.7 1,274 0.11 0.04 0.07 0.10 0.12 Annex I18.730,92475.878.0776961 Non-Annex I81.3 5,09624.222.0233139 High Income15.536,48876.977.9776961 Middle Income63.3 6,22622.921.9223038 Low Income21.2 1,599 0.2 0.3 0.5 World100%9,929 100 %
 GDP per capita ($US PPP) Capacity (% of global) Responsibility (% of global) RCI (% of global) RCI (% of global) RCI (% of global) EU , EU , EU , Switzerland0.1139, United states 4.545, Japan 1.933, Russia 2.015, China19.7 5, India17.2 2, South Africa 0.710, Mexico 1.612, LDCs11.7 1, Annex I18.730, Non-Annex I81.3 5, High Income15.536, Middle Income63.3 6, Low Income21.2 1, World100%9, %")
22
Fairly sharing the global emission reduction effort among countries according to Responsibility and Capability 22

23
Fairly sharing the global emission reduction effort among countries according to Responsibility and Capability 23

24
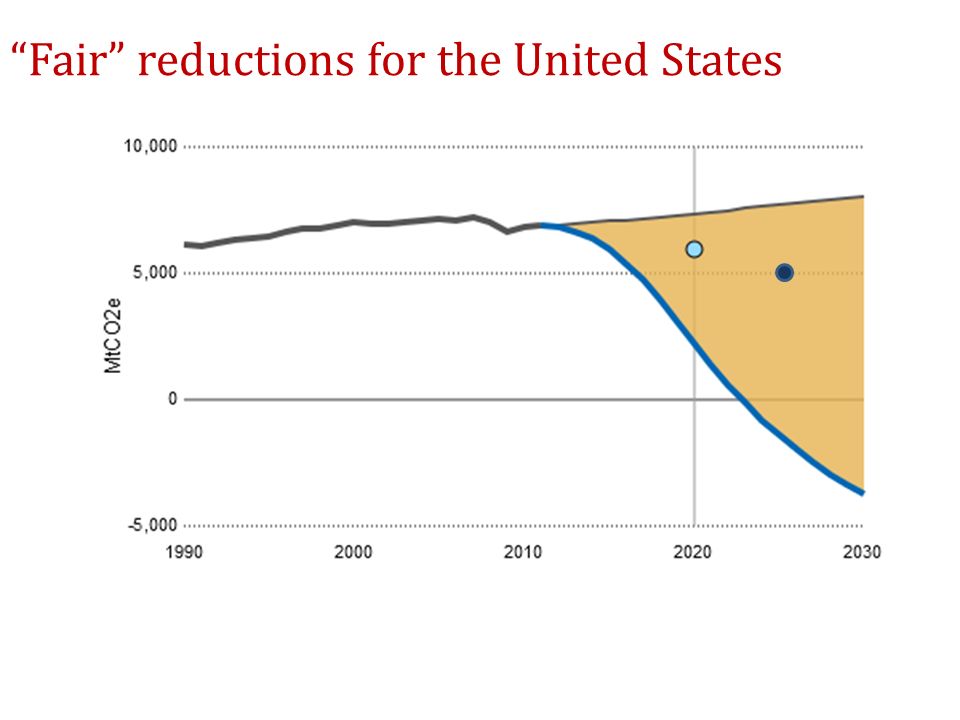
Example 1 The United States 24

25
“Fair” reductions for the United States

33
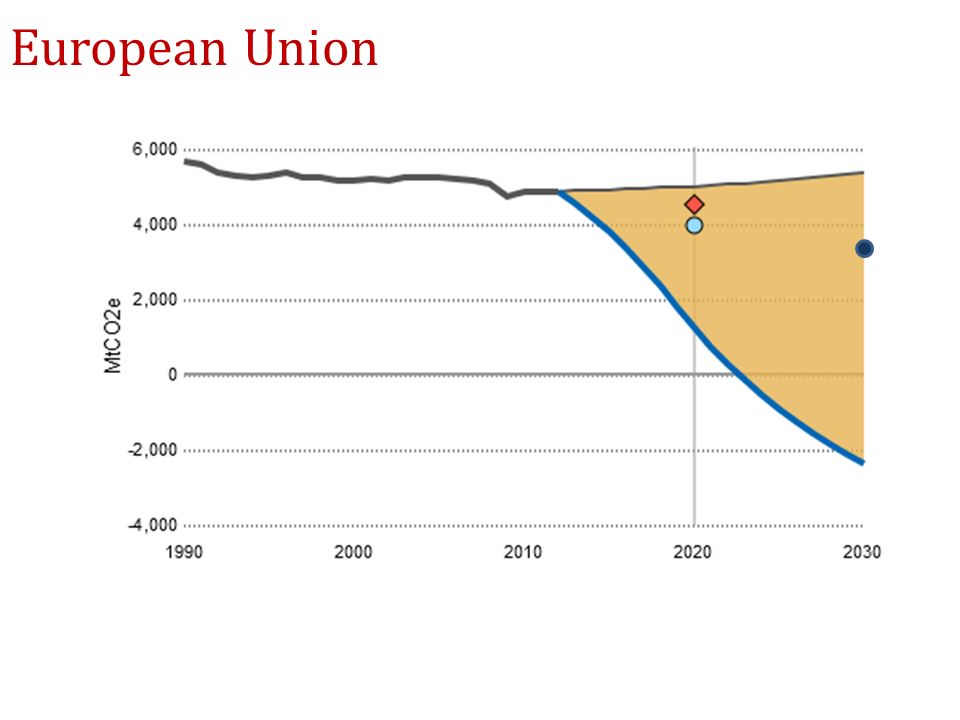
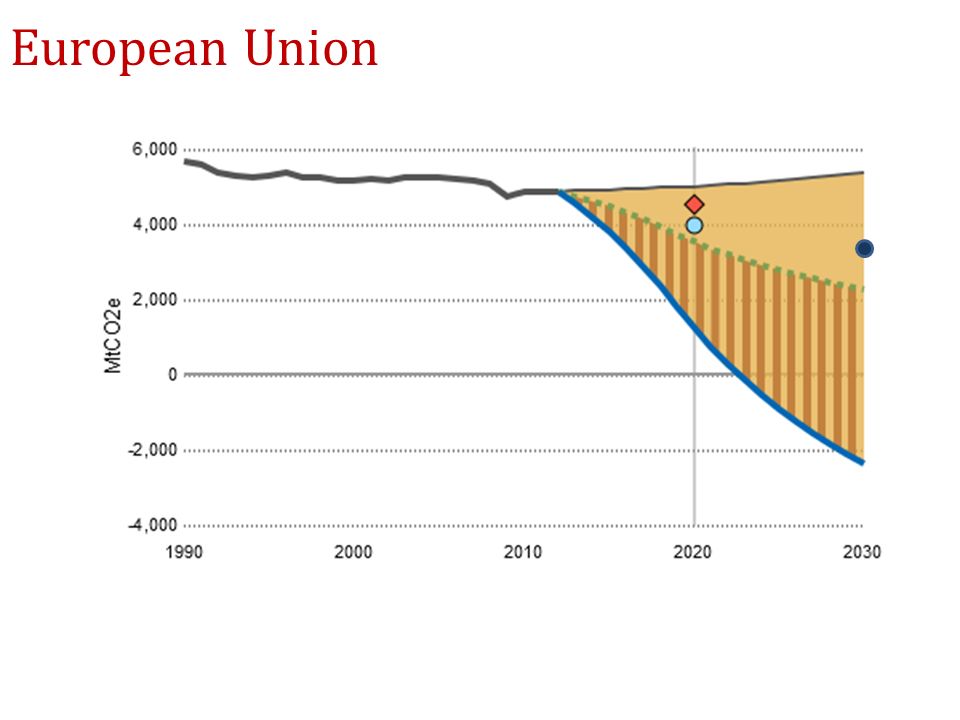
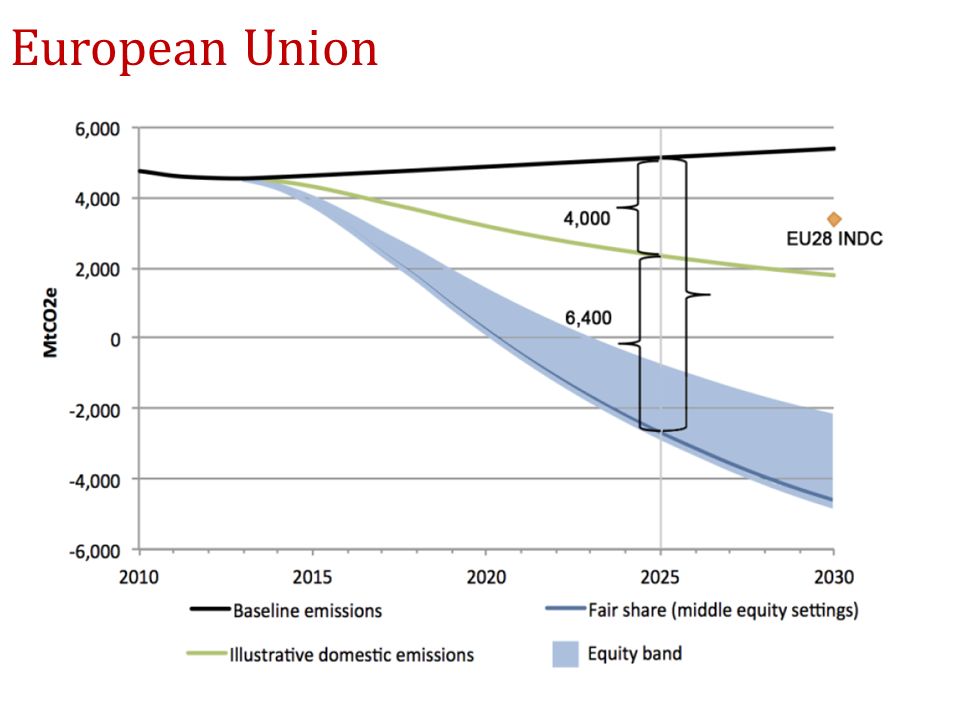
European Union

37
China 37

38
38 China

39
39 Final Comments The science is unambiguous. The climate is changing, and it presents severe risks. It is technically and economically possible to reduce emissions rapidly enough to keep warming below 2°C. It would mean carbon-based development is no longer an option in the North, nor in the South. A global transition to low emission future is likely to be achieved only if it is done cooperatively and in a way that is widely perceived to be fair. In the developed countries, deep emissions reductions are important and necessary. But only part of the story… Earnest efforts to enable the climate transition to occur globally, through cooperation with the developing countries through technology & financial support are equally crucial. (And won’t ruin our economies.) This isn’t just about equity and justice… it’s about being realistic about what is needed to preserve our own futures.
 This isn’t just about equity and justice… it’s about being realistic about what is needed to preserve our own futures..")
40
Thank you www.sei-international.org www.ClimateEquityReference.org National fair shares: The mitigation gap – domestic action and international support National Fair Shares (SEI Discussion Brief) The North-South divide, equity and development The Right to Development in a Climate Constrained World: The Greenhouse Development Rights FrameworkThe Right to Development in a Climate Constrained World: The Greenhouse Development Rights Framework 40
 The North-South divide, equity and development The Right to Development in a Climate Constrained World: The Greenhouse Development Rights FrameworkThe Right to Development in a Climate Constrained World: The Greenhouse Development Rights Framework 40")
41
41

42
42

43
Three 2° budgets (IPCC WGI) 43
 43")
44
44 Income and Capacity Income distributions (relative to development and luxury thresholds)
")
45
Capacity: three progressivity settings 45

46
High Equity SettingsLow Equity Settings Fair share (%) Mitigation (GtCO2e) Fair share (%) Mitigation (GtCO2e) EU’s INDC22%2.016%2.0 Rest of World78%7.184%10.5 Total Mitigation100%9.1100%12.5 G8 pathway25.3 Weak 2°C pathway37.7 Strong 2°C pathway46.7 The EU pledge, and what would be achieved if other countries pledged “comparable efforts” 46
 Mitigation (GtCO2e) Fair share (%) Mitigation (GtCO2e) EU’s INDC22%2.016%2.0 Rest of World78%7.184%10.5 Total Mitigation100%9.1100%12.5 G8 pathway25.3 Weak 2°C pathway37.7 Strong 2°C pathway46.7 The EU pledge, and what would be achieved if other countries pledged comparable efforts 46")
47
Do Unto Others – three paths 47

48
Example: EU, plus comparable efforts by others 48

Similar presentations


 UNFCCC Workshop on.>")


 Functionings (doings and beings) Evaluative.>")


