Download presentation
Presentation is loading. Please wait.

2
Defining The Cancer Burden for Cancer Control Presented by Thomas C. Tucker, PhD, MPH Associate Professor Department of Epidemiology College of Public Health University of Kentucky Associate Director for Cancer Control Markey Cancer Center University of Kentucky Director of the Kentucky Cancer Registry CCC Workshop - Atlanta, Georgia - August 7, 2012

3
Topics to be covered What is Cancer Control & why is data important? How do we measures the cancer burden? What are the major sources of data that can be used to describe the burden of cancer? Some specific limitations associated with using central cancer registry data for cancer control. What are the major cancer control sites? What is the logic model for using these major sources of data to define the burden of cancer? Combining sources of data to define the burden of cancer for the major cancer control sites in specific geographic areas? An example of how this process has worked.

4
What is “Cancer Control”? The use of evidence based prevention, early detection, treatment, and continuing care intervention strategies to reduce cancer incidence, morbidity and mortality in defined populations.

5
Phases of Cancer Control Early Detection PreventionDiagnosisTreatment Continuing Care

6
Data and Cancer Control What is striking about the definition of cancer control are it’s implications for the use of data at all phases of the cancer control continuum. Muir, et al. have said that “ data are an essential part of any rational program of cancer control ”. In fact, it is difficult to imagine any effective cancer control efforts that do not rely on some type of data collection and analysis. In essence, data represent the eyes of our cancer control program. Without these eyes, it would not be possible to see our cancer control problems and it would not be possible to see the impact of our cancer control activities.

7
What are the common sources of data that can be used for defining the cancer burden? Demographic data (Census U.S) Risk factor data (BRFSS) Incidence data (KCR) Mortality data (State Vital Records)
 Risk factor data (BRFSS) Incidence data (KCR) Mortality data (State Vital Records).")
8
Demographic (Census) data Covers the entire population Provides details on important factors that influence the burden of cancer in a population Is only done once every 10 years in the U.S. Is difficult to determine the number of people in a population by race and ethnicity.

9
Behavioral Risk Factor Surveillance System Largest telephone survey in the world Tracks many important health risks Complex sample design Difficult to generalize the information to small populations

10
Incidence Data Closer in time to causal events Represents both occurrence and risk of getting disease Difficult to get all of the cases Complex coding rules Screening effect

11
Mortality Data Very complete data Represents the ultimate negative health outcome Far away in time from causal factors Care must be taken to use consolidated death records

12
Difficulties Associated with Using Central Cancer Registry Data for Cancer Prevention and Control The screening effect Difficulties associated with the occurrence of cancer in very small populations

13
Screening Effect What happens to the female breast cancer incidence rate in a population when more women have mammography screening? What happens to the colorectal cancer incidence rate in a population when more people are screened using colonoscopy?

14
Difficulties associated with the occurrence of cancer in very small populations The difference between “counts” (frequency) and “rates” (Risk).The difference between “counts” (frequency) and “rates” (Risk). Community A: Population 1 million, Count = 1000 cases Crude Rate = 1000/1,000,000x100,000 = 100 per 100,000 Pop.Community A: Population 1 million, Count = 1000 cases Crude Rate = 1000/1,000,000x100,000 = 100 per 100,000 Pop. Community B: Population 100,000, Count = 100 cases Crude Rate = 100/100,000x100,000 = 100 per 100,000 Pop.Community B: Population 100,000, Count = 100 cases Crude Rate = 100/100,000x100,000 = 100 per 100,000 Pop. Community C: Population 1000, Count = 2 cases Crude Rate = 2/1000x100,000 = 200 per 100,000 Pop.Community C: Population 1000, Count = 2 cases Crude Rate = 2/1000x100,000 = 200 per 100,000 Pop.

15
Difficulties associated the occurrence of cancer in very small populations (Cont.) Difficulties associated with the occurrence of cancer in very small populations (Cont.) Sentinel surveillance techniques can be used when communities have small populations and low cases counts. Population scientists can help determine if the frequency of cancer is normal (endemic) or abnormal (epidemic).. Cancer rates are considered to be unstable when case counts are less then 15.
 or abnormal (epidemic).. Cancer rates are considered to be unstable when case counts are less then 15..")
16
Number of Cases

17
What are the major cancer control sites?

18
Most Common Cancer Control Sites 58 % of Total Cancer Cases in the U.S.

19
Most Common Cancer Control Sites 62 % of Total Cancer Cases in Kentucky All genders, all races, 2001-2005

20
Most Common Cancer Control Sites 59 % of Total Cancers Deaths in Kentucky All genders, all races, 2001-2005

21
Demographic Characteristics Contribute to Risk Factors Contribute to Incidence and Late Stage DX Contribute to Cancer Mortality Combining Data from Multiple Sources Logic Model

22
Methodology (Approach) Used in the C-Change/NAACCR Project The association between the demographic, risk, incidence, stage at diagnosis and mortality variables were explored using bivariate regression models. Variables with R-Squared values.25 or greater were used to construct the initial index for each type of cancer. The index was created using a simple rank sum technique. States were ranked from the highest to lowest cancer burden and placed into five groups with red being the states with the highest burden of cancer and green being those states with the lowest cancer burden. Highest BurdenLowest Burden

23
Lung Cancer

27
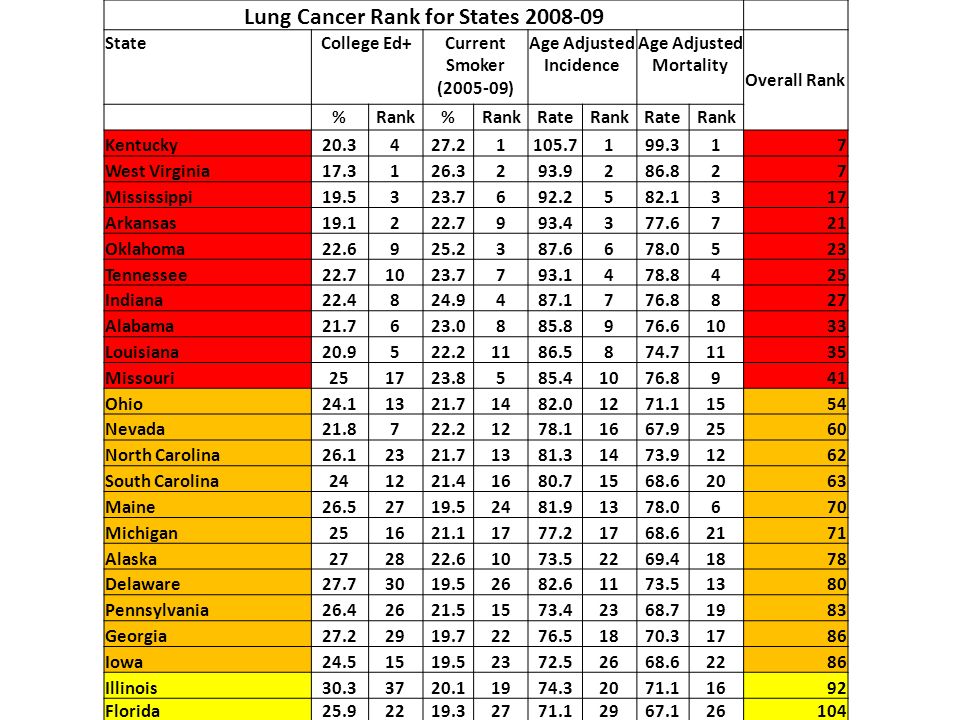
Lung Cancer Rank for States 2008-09 StateCollege Ed+Current Smoker (2005-09) Age Adjusted Incidence Age Adjusted Mortality Overall Rank %Rank% RateRankRateRank Kentucky20.3427.21105.7199.317 West Virginia17.3126.3293.9286.827 Mississippi19.5323.7692.2582.1317 Arkansas19.1222.7993.4377.6721 Oklahoma22.6925.2387.6678.0523 Tennessee22.71023.7793.1478.8425 Indiana22.4824.9487.1776.8827 Alabama21.7623.0885.8976.61033 Louisiana20.9522.21186.5874.71135 Missouri251723.8585.41076.8941 Ohio24.11321.71482.01271.11554 Nevada21.8722.21278.11667.92560 North Carolina26.12321.71381.31473.91262 South Carolina241221.41680.71568.62063 Maine26.52719.52481.91378.0670 Michigan251621.11777.21768.62171 Alaska272822.61073.52269.41878 Delaware27.73019.52682.61173.51380 Pennsylvania26.42621.51573.42368.71983 Georgia27.22919.72276.51870.31786 Iowa24.51519.52372.52668.62286 Illinois30.33720.11974.32071.11692 Florida25.92219.32771.12967.126104
 Age Adjusted Incidence Age Adjusted Mortality Overall Rank %Rank% RateRankRateRank Kentucky West Virginia Mississippi Arkansas Oklahoma Tennessee Indiana Alabama Louisiana Missouri Ohio Nevada North Carolina South Carolina Maine Michigan Alaska Delaware Pennsylvania Georgia Iowa Illinois Florida")
28
Wyoming23.61120.91863.53953.942110 Rhode Island30.33817.73874.12173.414111 Wisconsin25.82119.92067.43554.740116 South Dakota25.31819.02868.23254.839117 Texas25.82018.73167.93361.234118 Virginia33.84318.83075.71966.028120 Oregon28.63317.63972.72563.330127 New Hampshire32.94218.23471.62768.024127 Montana27.93218.63270.13060.835129 Nebraska27.73119.02967.13659.536132 North Dakota26.32519.52562.54154.741132 New Mexico25.51919.92151.44844.848136 Idaho24.31417.44060.04352.844141 Massachusetts38.34816.74471.52868.323143 New York32.14118.53362.04263.629145 Maryland35.74616.74373.32461.933146 Washington313916.44669.73162.931147 Arizona26.32418.03657.94453.243147 New Jersey34.64416.74265.93762.132155 Minnesota31.44017.83763.24056.338155 Connecticut35.24516.14764.63866.627157 Washington DC49.24917.34167.93456.937161 Hawaii29.43416.54553.74651.645170 California30.13614.34856.64550.546175 Colorado35.94718.23552.84749.747176 Utah29.43510.44930.54926.249182 Lung Cancer Rank for States 2008-09 StateCollege Ed+Current Smoker Age Adjusted Incidence Age Adjusted Mortality Overall Rank %Rank% RateRankRateRank

29
Summery of top ten states with the highest burden for each type of cancer Lung Kentucky West Virginia Mississippi Tennessee Oklahoma Arkansas Indiana Alabama Louisiana Missouri Breast Mississippi Arkansas Oklahoma Louisiana West Virginia Alabama Texas Kentucky Nevada Tennessee Colorectal Mississippi Louisiana West Virginia Oklahoma Kentucky Alabama Arkansas Indiana Illinois Nebraska Cervical Arkansas Louisiana Oklahoma West Virginia Mississippi Texas Alabama Kentucky Nevada Wyoming

31
Cancer Control in Kentucky The Kentucky Cancer Registry develops a profile of the cancer burden for the major cancers in each of the states 15 Area Development Districts (ADD’s) and presents these data annually to the District Cancer Councils that have been established in each ADD
 and presents these data annually to the District Cancer Councils that have been established in each ADD")
32
Model for Cancer Control (Cancer control can be defined as “activities designed to reduce morbidity and mortality from cancer”) Kentucky Cancer Program Select Target Population Develop Intervention Strategy Evaluate the Impact of Intervention Implement Intervention Plan Identify Problem MeasurePlanActMeasure Registry Data Other Data Health Care Providers Community Health Care Providers Others Registry Data Other Data
 Kentucky Cancer Program Select Target Population Develop Intervention Strategy Evaluate the Impact of Intervention Implement Intervention Plan Identify Problem MeasurePlanActMeasure Registry Data Other Data Health Care Providers Community Health Care Providers Others Registry Data Other Data")
34
Lung Cancer By Area Development District in KY 2004-08 Area Development District High School Education (%) Under Poverty Level (%) Current Smoker (%) Age-Adjusted Incidence Late Stage Incidence (%) Age-Adjusted Mortality N Adj. Rate N US80.412.419.96292,4956279.73%229,103*52.5* KENTUCKY74.115.827.622692100.8480.7%1676675.06 BARREN RIVER70.316.730.91525104.8682.8%112577.8 BIG SANDY59.627.931.41083124.9682.6%82396.15 BLUEGRASS79.013.124.9339193.6780.8%254571.17 BUFFALO TRACE66.619.633.5331101.0279.4%24776.3 CUMBERLAND VALLEY58.029.130.41552117.0881.3%114387.37 FIVECO71.218.830.984699.7179.4%62974.54 GATEWAY65.021.229.541196.4581.8%33880.32 GREEN RIVER77.113.727.21246103.4979.8%92476.82 KENTUCKY RIVER56.031.033.3827125.2685.1%63397.43 KIPDA81.311.524.8459396.478.7%330869.79 LAKE CUMBERLAND61.323.028.81289102.8978.6%98178.5 LINCOLN TRAIL76.112.930.2126796.7379.5%84665.96 NORTHERN KENTUCKY80.69.027.0192698.1982.1%146475.4 PENNYRILE71.715.930.3116994.5482.7%86070.02 PURCHASE77.115.027.0123699.2981.4%90071.6

38
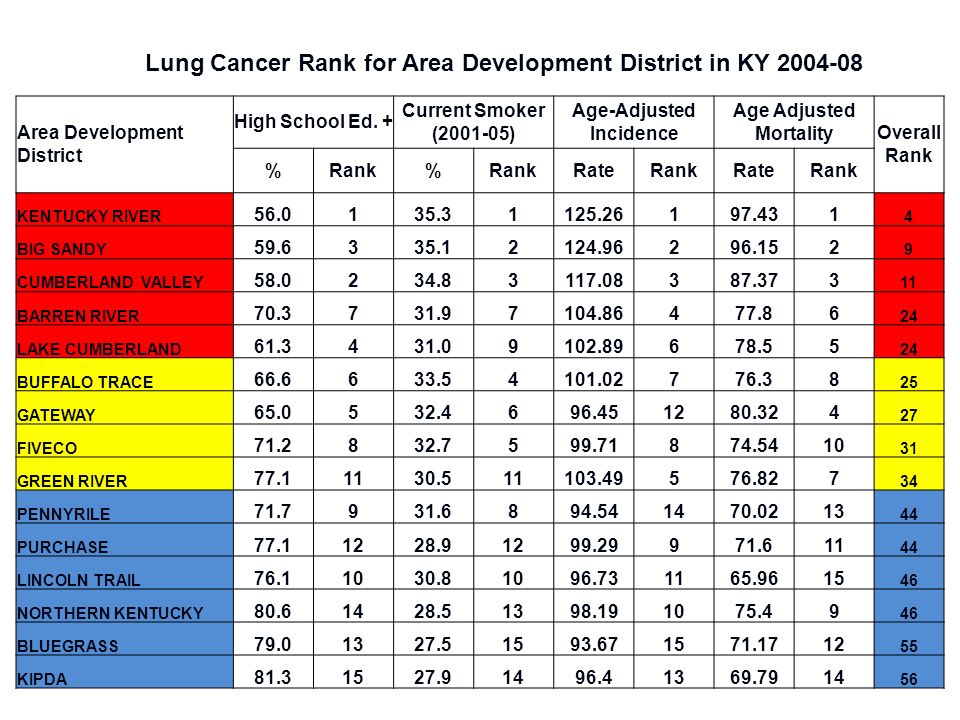
Lung Cancer Rank for Area Development District in KY 2004-08 Area Development District High School Ed. + Current Smoker (2001-05) Age-Adjusted Incidence Age Adjusted Mortality Overall Rank %Rank% RateRankRateRank KENTUCKY RIVER 56.0135.31125.26197.431 4 BIG SANDY 59.6335.12124.96296.152 9 CUMBERLAND VALLEY 58.0234.83117.08387.373 11 BARREN RIVER 70.3731.97104.86477.86 24 LAKE CUMBERLAND 61.3431.09102.89678.55 24 BUFFALO TRACE 66.6633.54101.02776.38 25 GATEWAY 65.0532.4696.451280.324 27 FIVECO 71.2832.7599.71874.5410 31 GREEN RIVER 77.11130.511103.49576.827 34 PENNYRILE 71.7931.6894.541470.0213 44 PURCHASE 77.11228.91299.29971.611 44 LINCOLN TRAIL 76.11030.81096.731165.9615 46 NORTHERN KENTUCKY 80.61428.51398.191075.49 46 BLUEGRASS 79.01327.51593.671571.1712 55 KIPDA 81.31527.91496.41369.7914 56
 Age-Adjusted Incidence Age Adjusted Mortality Overall Rank %Rank% RateRankRateRank KENTUCKY RIVER BIG SANDY CUMBERLAND VALLEY BARREN RIVER LAKE CUMBERLAND BUFFALO TRACE GATEWAY FIVECO GREEN RIVER PENNYRILE PURCHASE LINCOLN TRAIL NORTHERN KENTUCKY BLUEGRASS KIPDA")
40
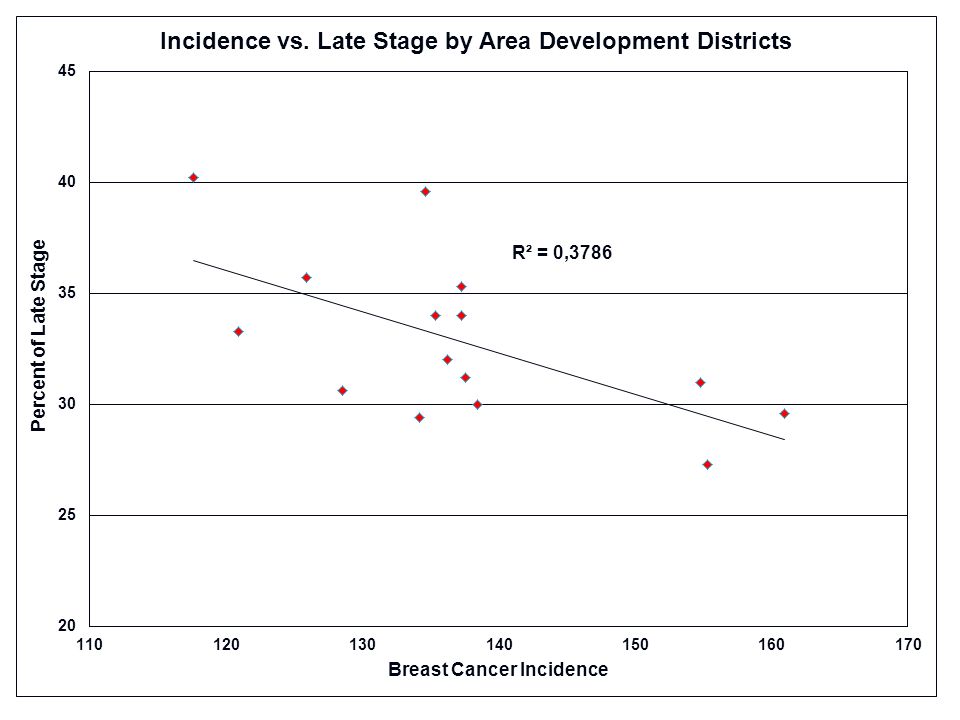
Breast Cancer by Area Development District in KY (2004-2008) Area Development District High School Education (%) Under Poverty Level (%) Mammography Screening Rate (%) Age-Adjusted Incidence Late Stage Incidence Age-Adjusted Mortality N Adj. Rate N US 80.412.479.2317,856154.929.45205107*24* KENTUCKY 74.115.877.417611144.6830.7294023.41 BARREN RIVER 70.316.771.11042136.233220324.75 BIG SANDY 59.627.974.3637137.293414129.75 BLUEGRASS 79.013.179.63120155.327.349524.58 BUFFALO TRACE 66.619.672.6232137.2735.34223.41 CUMBERLAND VALLEY 58.029.167.6957135.353417123.93 FIVECO 71.218.872.4586134.6239.610723.81 GATEWAY 65.021.266.5267120.9233.35222.87 GREEN RIVER 77.113.778.4855134.229.415322.76 KENTUCKY RIVER 56.031.067.8417117.6440.26618.21 KIPDA 81.311.583.44287160.9629.668324.66 LAKE CUMBERLAND 61.323.076.2792125.935.714421.25 LINCOLN TRAIL 76.112.977.8980138.443016022.66 NORTHERN KENTUCKY 80.69.076.71725154.783126223.58 PENNYRILE 71.715.977.7836128.530.613819.77 PURCHASE 77.115.080.3878137.5731.212317.96

44
Breast Cancer Rank for Area Development District in KY 2004-08 Area Development District High School Ed. + Mamography Screening Age-Adjusted Incidence Late Stage Incidence Overall Rank %Rank% RateRank% KENTUCKY RIVER 56.0167.83117.64140.1%16 GATEWAY 65.0566.51120.92233.3%614 CUMBERLAND VALLEY 58.0267.62135.35734.0%516 LAKE CUMBERLAND 61.3476.28125.9335.7%217 BIG SANDY 59.6374.37137.291034.0%424 BUFFALO TRACE 66.6672.66137.27935.3%324 BARREN RIVER 70.3771.14136.23832.0%726 FIVECO 71.2872.45134.62629.6%1332 PENNYRILE 71.7977.710128.5430.6%1033 GREEN RIVER 77.11278.412134.2529.4%1443 LINCOLN TRAIL 76.11077.811138.441230.0%1144 PURCHASE 77.11180.314137.571131.2%844 NORTHERN KENTUCKY 80.61476.79154.781331.0%945 BLUEGRASS 79.01379.613155.31427.3%1555 KIPDA 81.31583.415160.961529.6%1257

46
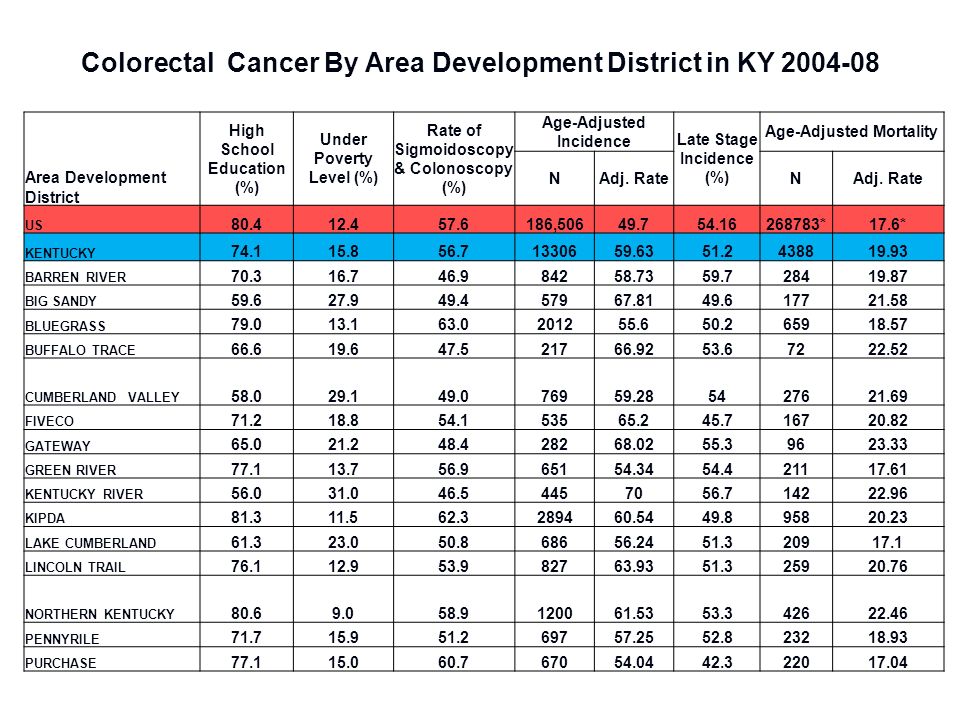
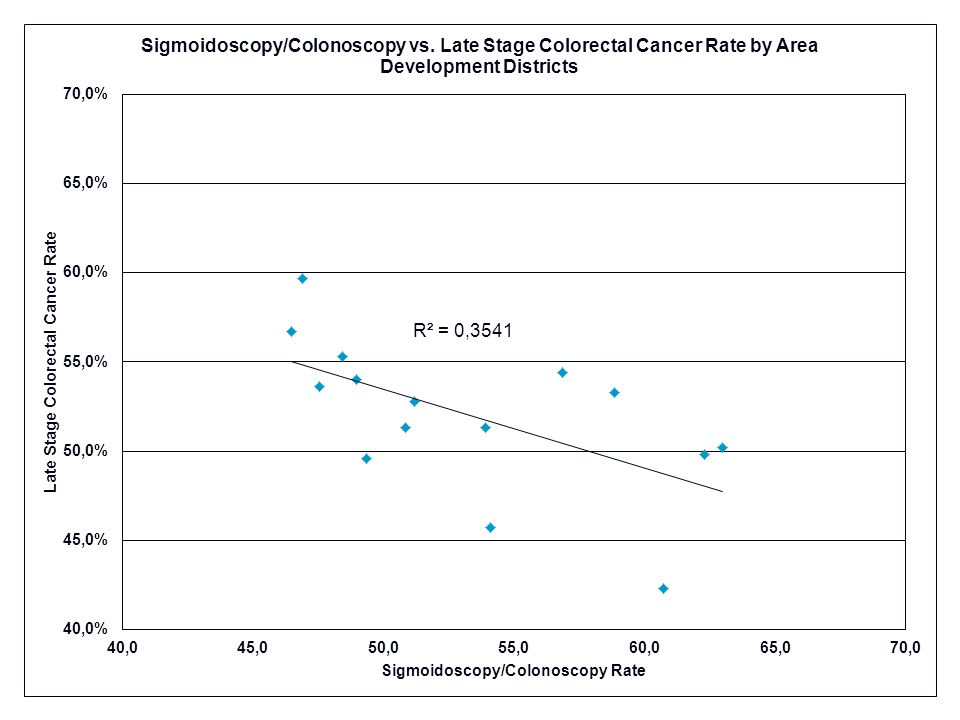
Colorectal Cancer By Area Development District in KY 2004-08 * Mortality Rates for US is 2003-07 Area Development District High School Education (%) Under Poverty Level (%) Rate of Sigmoidoscopy & Colonoscopy (%) Age-Adjusted Incidence Late Stage Incidence (%) Age-Adjusted Mortality NAdj. RateN US 80.412.457.6186,50649.754.16268783*17.6* KENTUCKY 74.115.856.71330659.6351.2438819.93 BARREN RIVER 70.316.746.984258.7359.728419.87 BIG SANDY 59.627.949.457967.8149.617721.58 BLUEGRASS 79.013.163.0201255.650.265918.57 BUFFALO TRACE 66.619.647.521766.9253.67222.52 CUMBERLAND VALLEY 58.029.149.076959.285427621.69 FIVECO 71.218.854.153565.245.716720.82 GATEWAY 65.021.248.428268.0255.39623.33 GREEN RIVER 77.113.756.965154.3454.421117.61 KENTUCKY RIVER 56.031.046.54457056.714222.96 KIPDA 81.311.562.3289460.5449.895820.23 LAKE CUMBERLAND 61.323.050.868656.2451.320917.1 LINCOLN TRAIL 76.112.953.982763.9351.325920.76 NORTHERN KENTUCKY 80.69.058.9120061.5353.342622.46 PENNYRILE 71.715.951.269757.2552.823218.93 PURCHASE 77.115.060.767054.0442.322017.04

49
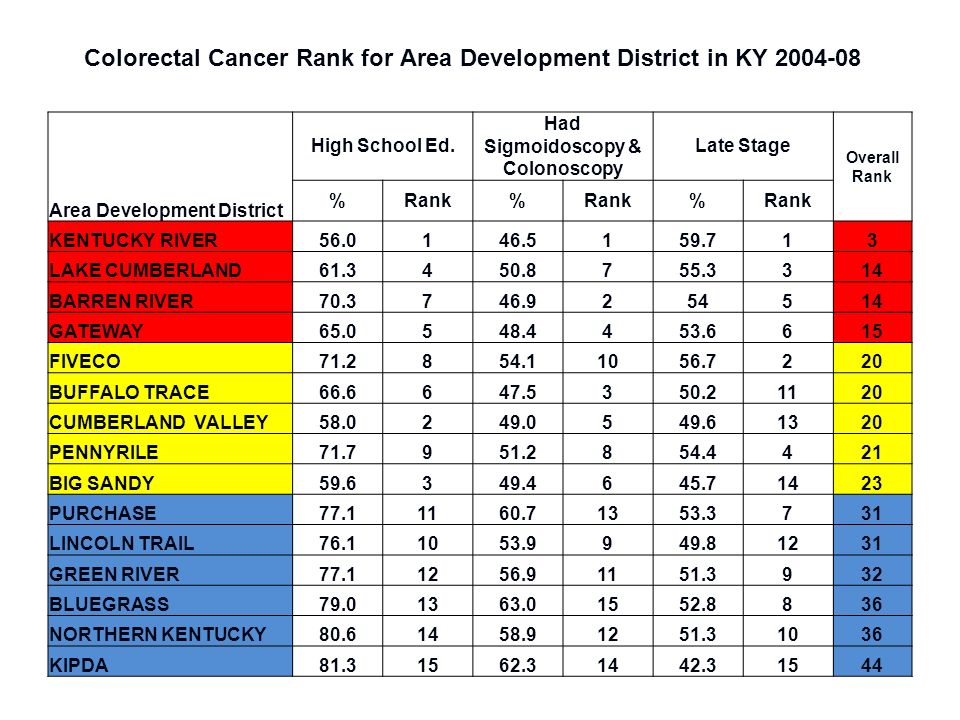
Colorectal Cancer Rank for Area Development District in KY 2004-08 Area Development District High School Ed. Had Sigmoidoscopy & Colonoscopy Late Stage Overall Rank %Rank% % KENTUCKY RIVER56.0146.5159.713 LAKE CUMBERLAND61.3450.8755.3314 BARREN RIVER70.3746.9254514 GATEWAY65.0548.4453.6615 FIVECO71.2854.11056.7220 BUFFALO TRACE66.6647.5350.21120 CUMBERLAND VALLEY58.0249.0549.61320 PENNYRILE71.7951.2854.4421 BIG SANDY59.6349.4645.71423 PURCHASE77.11160.71353.3731 LINCOLN TRAIL76.11053.9949.81231 GREEN RIVER77.11256.91151.3932 BLUEGRASS79.01363.01552.8836 NORTHERN KENTUCKY80.61458.91251.31036 KIPDA81.31562.31442.31544

50
An Example In 2001, Kentucky had the highest colorectal cancer incidence rate in the U.S. compared to all of the other states

51
In 2001, it was also noted that Kentucky was ranked 49 th in colorectal cancer screening compared to all other states with the second to the lowest rate (34.7% of the age eligible population).
.")
52
Using the process for cancer control that was previously described, data about the burden of colorectal cancer was assembled and presented to each of the 15 District Cancer Councils. Following these presentations, all of the District Cancer Councils have implemented cancer control programs aimed at increasing colorectal cancer screening for age eligible people living in Kentucky.

53
What has happened since the implementation of these cancer prevention and control programs?

54
Source: CDC/BRFSS Website, Accessed Jan. 2010

55
By 2008, Kentucky was ranked 23 rd among all states in colorectal cancer screening. This is a remarkable improvement not matched by any other state. In other words, no state improved it’s colorectal cancer screening rate in such a short period of time more then Kentucky.

56
The increase in colorectal cancer screening has also been accompanied by a 16% decrease in both the incidence and mortality of colorectal cancer in Kentucky. It is important to note that these changes are statistically significant (P<.05). In other words, it is unlikely that these changes happened by random accident.
. In other words, it is unlikely that these changes happened by random accident..")
57
P<.05 Source: KCR Website, Accessed Jan. 2010

58
P<.05 Source: KCR Website, Accessed Jan. 2010

59
A 16% reduction in colorectal cancer incidence and mortality in Kentucky is a significant public health success.

60
Cancer Surveillance Data Cancer Control Activities Together we can make a real difference in peoples lives

61
Thank You! Questions The End

Similar presentations


 Arkansas Michigan CALIFORNIA MINNESOTA COLORADO NEVADA CONNECTICUT New Hampshire.>")


 of 30 or higher. Body Mass Index (BMI): A measure of an.>")
 of 30 or higher.>")


44% b)53%>")

