Download presentation
Presentation is loading. Please wait.

2
Colorectal Cancer in Kentucky Trends and Geographic Variation 2000 - 2008 Presented by Thomas C. Tucker, PhD, MPH Associate Professor Department of Epidemiology College of Public Health University of Kentucky and Senior Director for Cancer Surveillance Markey Cancer Center University of Kentucky Colon cancer Advisory Committee –Frankfort, KY – August 18, 2011

3
In 2001, Kentucky had the highest colorectal cancer incidence rate in the U.S. compared to all of the other states

4
In 2001, it was also noted that Kentucky was ranked 50 th in colorectal cancer screening compared to all other states with the very lowest rate (34.7% of the age eligible population).
.")
5
Data about the burden of colorectal cancer was assembled and presented to each of the 15 District Cancer Councils. Following these presentations, all of the District Cancer Councils have implemented cancer control programs aimed at increasing colorectal cancer screening for age eligible people living in Kentucky

6
What has happened since the implementation of these cancer prevention and control programs?

7
Source: CDC/BRFSS Website, Accessed Jan. 2010

8
Kentucky is now ranked 23 rd among all states in colorectal cancer screening. This is a remarkable improvement not matched by any other state. In other words, no state improved it’s colorectal cancer screening rate in such a short period of time more then Kentucky.

9
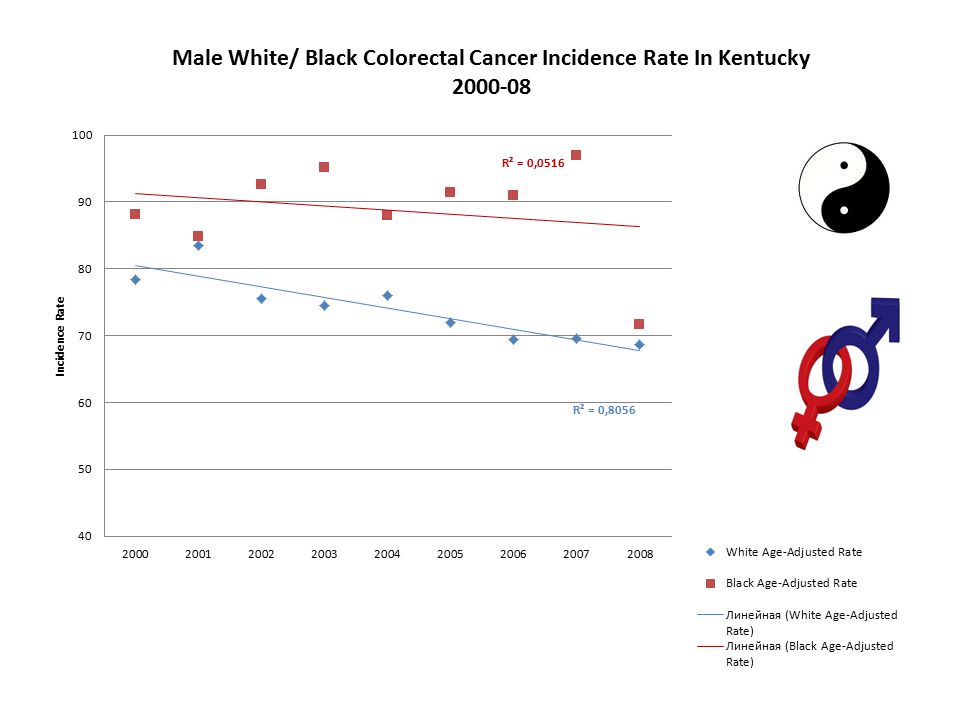
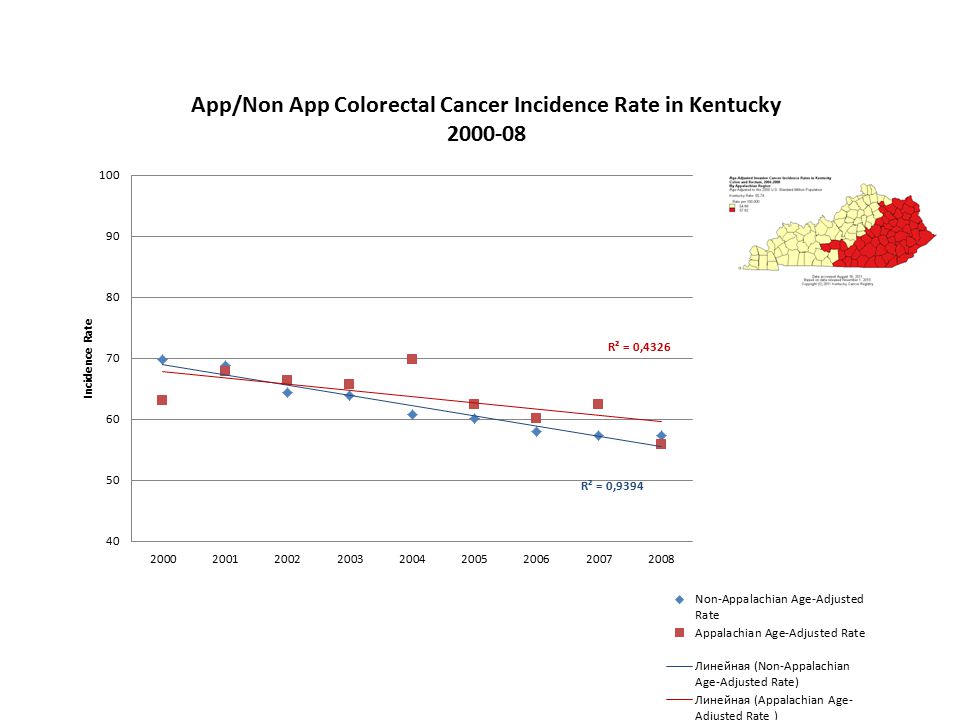
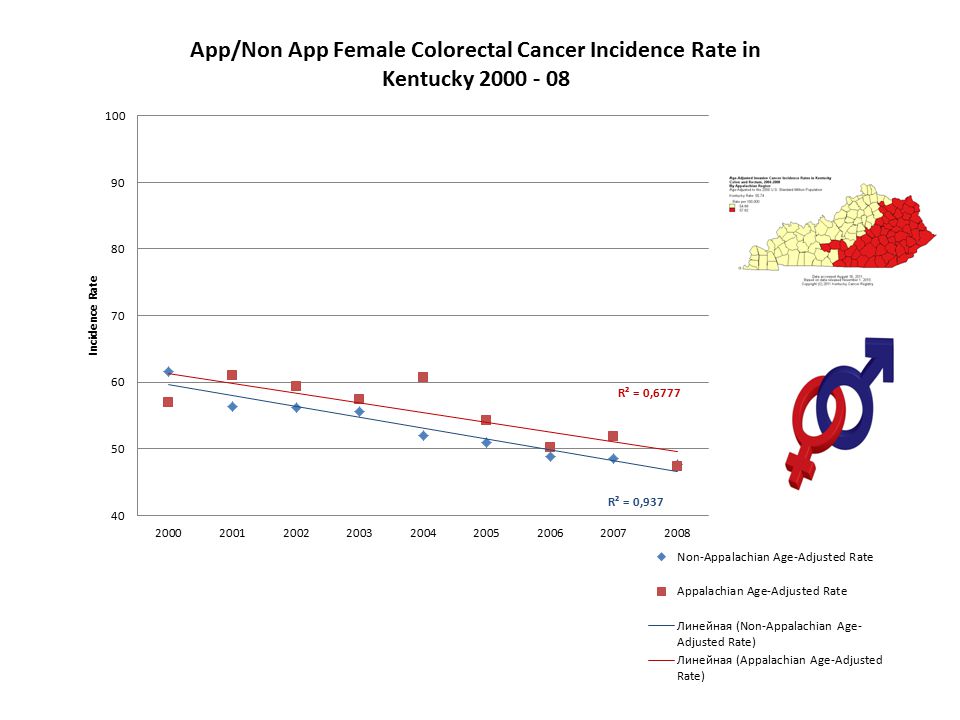
The increase in colorectal cancer screening has also been accompanied by a 16% decrease in both the incidence and mortality of colorectal cancer in Kentucky. It is important to note that these changes are statistically significant (P<.05). In other words, it is unlikely that these changes happened by random accident.
. In other words, it is unlikely that these changes happened by random accident..")
10
P<.05 Source: KCR Website, Accessed Jan. 2010

11
P<.05 Source: KCR Website, Accessed Jan. 2010

12
Incidence Rate

23
Other sources of data that can be used Demographic data (Census) Risk factor data (BRFSS) Incidence data (KCR) Mortality data (State vital records)
 Risk factor data (BRFSS) Incidence data (KCR) Mortality data (State vital records)")
24
Demographic Characteristics Contribute to… Risk Factors Contribute to… Incidence or Late Stage DX Contribute to… Cancer Mortality Reason for Combining Sources of Data Logic Model

25
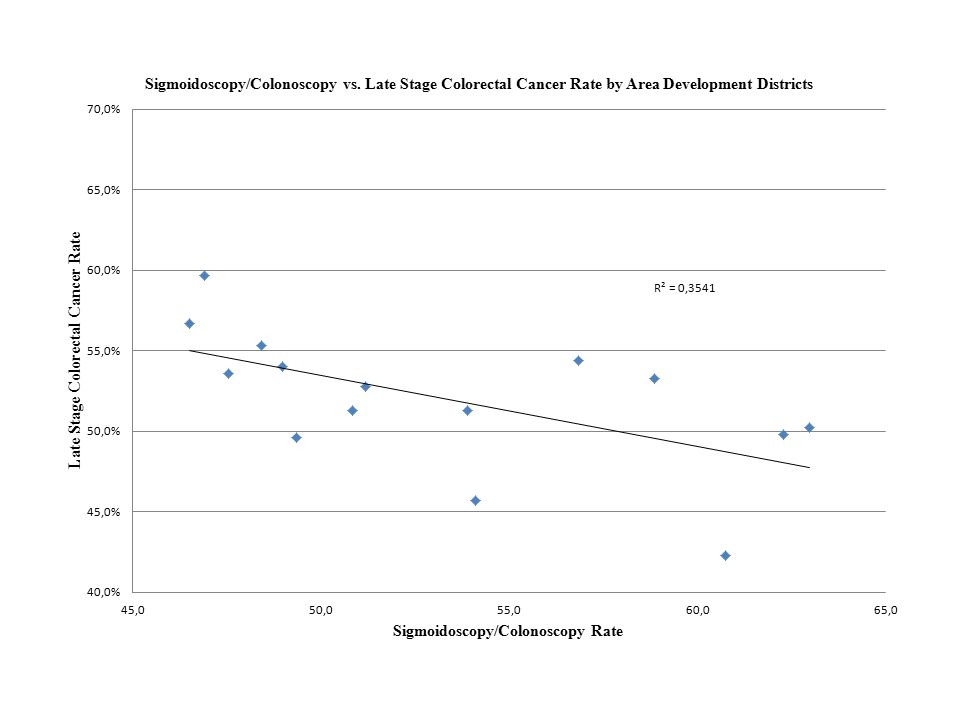
Colorectal Cancer By Area Development District in KY 2004-08 * Mortality Rates for US is 2003-07 Area Development District High School + Education (%) Under Poverty Level (%) Rate of Sigmoidoscopy & Colonoscopy (%) Age-Adjusted Incidence Late Stage Incidence (%) Age-Adjusted Mortality NAdj. RateN US80.412.457.6186,50649.7 54.16 268783*17.6* KENTUCKY74.115.8 56.7 1330659.63 51.2 438819.93 BARREN RIVER70.316.746.984258.7359.728419.87 BIG SANDY59.627.949.457967.8149.617721.58 BLUEGRASS79.013.163.0201255.650.265918.57 BUFFALO TRACE66.619.647.521766.9253.67222.52 CUMBERLAND VALLEY58.029.149.076959.285427621.69 FIVECO71.218.854.153565.245.716720.82 GATEWAY65.021.248.428268.0255.39623.33 GREEN RIVER77.113.756.965154.3454.421117.61 KENTUCKY RIVER56.031.046.54457056.714222.96 KIPDA81.311.562.3289460.5449.895820.23 LAKE CUMBERLAND61.323.050.868656.2451.320917.1 LINCOLN TRAIL76.112.953.982763.9351.325920.76 NORTHERN KENTUCKY80.69.058.9120061.5353.342622.46 PENNYRILE71.715.951.269757.2552.823218.93 PURCHASE77.115.060.767054.0442.322017.04

28
Cancer Control in Kentucky The Kentucky Cancer Registry develops a profile of the cancer burden for the major cancers in each of the states 15 Area Development Districts (ADD’s) and presents these data annually to the District Cancer Councils that have been established in each ADD
 and presents these data annually to the District Cancer Councils that have been established in each ADD")
29
Colorectal Cancer Rank for Area Development District in KY 2004-08 Area Development District High School Ed. + Had Sigmoidoscopy & Colonoscopy Late Stage Overall Rank %Rank% % KENTUCKY RIVER56.0146.5159.713 LAKE CUMBERLAND61.3450.8755.3314 BARREN RIVER70.3746.9254514 GATEWAY65.0548.4453.6615 FIVECO71.2854.11056.7220 BUFFALO TRACE66.6647.5350.21120 CUMBERLAND VALLEY58.0249.0549.61320 PENNYRILE71.7951.2854.4421 BIG SANDY59.6349.4645.71423 PURCHASE77.11160.71353.3731 LINCOLN TRAIL76.11053.9949.81231 GREEN RIVER77.11256.91151.3932 BLUEGRASS79.01363.01552.8836 NORTHERN KENTUCKY80.61458.91251.31036 KIPDA81.31562.31442.31544

30
Cancer Surveillance Data Cancer Control Activities Together we can make a real difference in peoples lives.

Similar presentations


 Highlights from the Northwest Territories Cancer Report March 2014.>")


