Download presentation
Presentation is loading. Please wait.

1
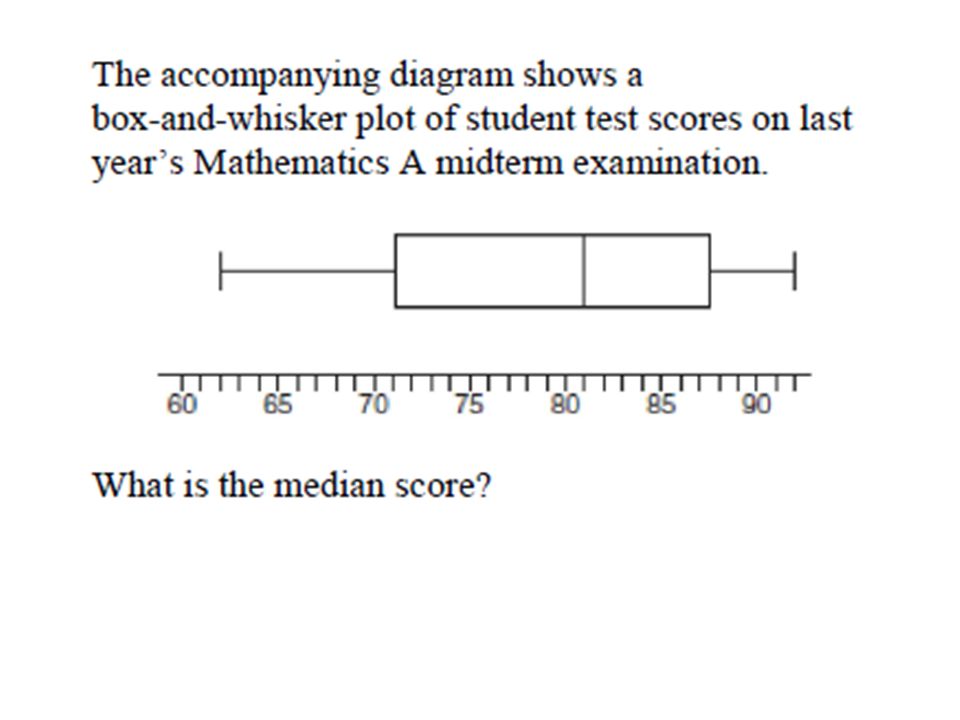
Tuesday May 13, 2014 AIM: How do we create a box-and-whisker plot? DO NOW: The values of 11 houses on Washington St. are shown in the table. 1) Find the median value of these houses in dollars. 2) Find the mode value of these houses in dollars. 3) Find the range value of these houses in dollars.
 Find the median value of these houses in dollars. 2) Find the mode value of these houses in dollars. 3) Find the range value of these houses in dollars..")
2
Mock Regents Exam Schedule May 2014 o On Mock Regents Days NOTED IN THE GRID BELOW: Only students scheduled to take the mock exams must report to school. All other students remain home. o Students must wear the official uniform on Mock Regents Days. o Mock Regents are MANDATORY. o Mock Regents provide students an opportunity to take regents exams as a preparation—with all required accommodations—for the REAL regents examinations which take place in June! Subject(s)Day/Date/Time Algebra Students who are currently in Ms. Ryan’s class or Mr. Penoro’s 3 rd period class MUST TAKE THIS MOCK EXAM. Wednesday May 14 8am—12noon Latin Living Environment English (ELA) Tuesday May 20 8am—12noon U.S. History Global History Thursday May 29 8am—12noon
Day/Date/Time Algebra Students who are currently in Ms. Ryan’s class or Mr. Penoro’s 3 rd period class MUST TAKE THIS MOCK EXAM. Wednesday May 14 8am—12noon Latin Living Environment English (ELA) Tuesday May 20 8am—12noon U.S. History Global History Thursday May 29 8am—12noon.")
4
What is a box-and-whisker plot? Copy All!

5
Copy in your notes! Do Not Copy Scale!

6
Five Statistical Summary ( 5 number summary) 1. Minimum 2. First Quartile AKA lower quartile: – first half of the data’s median 3. Second Quartile – Median 4. Third Quartile AKA upper quartile – second half of the data’s median 5. Maximum

7
EX: The heights of students: 53, 60, 61, 63, 64, 65, 66, Find the 5 number summary

8
Topic: Box and Whisker Plot 1. Draw a scale. 2. Above the scale, place dots to represent the five – number summary for the data 3. Draw a box from Quartile 1 and Quartile 3. 4. Connect the “whiskers” from the box to minimum and maximum.

9
EX: The heights of students: 53, 60, 61, 63, 64, 65 Find the 5 number summary

10
Together!

13
On p. 749 do numbers 1, 2, 8 - 14 Work on classwork

17
Wrap Up! The median of the lower half of the data is called the __________ _________ The median of the upper half of the data is called the ________ __________ The 5 number summary contains __________, _______, _________, _________, and ________.

Similar presentations


 on a CD are listed below. Make a box-and-whisker plot of the song.>")


. Boxplot A graph of a set of data obtained by drawing a horizontal line from the minimum to maximum values with quartiles.>")


 from one sample data distribution.>")


