Download presentation
Presentation is loading. Please wait.

1
1106: Geographical Information: a primer Communicating with Cartography 29/10/2004

2
TOPICS How does a map communicate? Thematic maps Topographic information Abstract maps Geographical Information Systems Practical info for NEXT WEEK

3
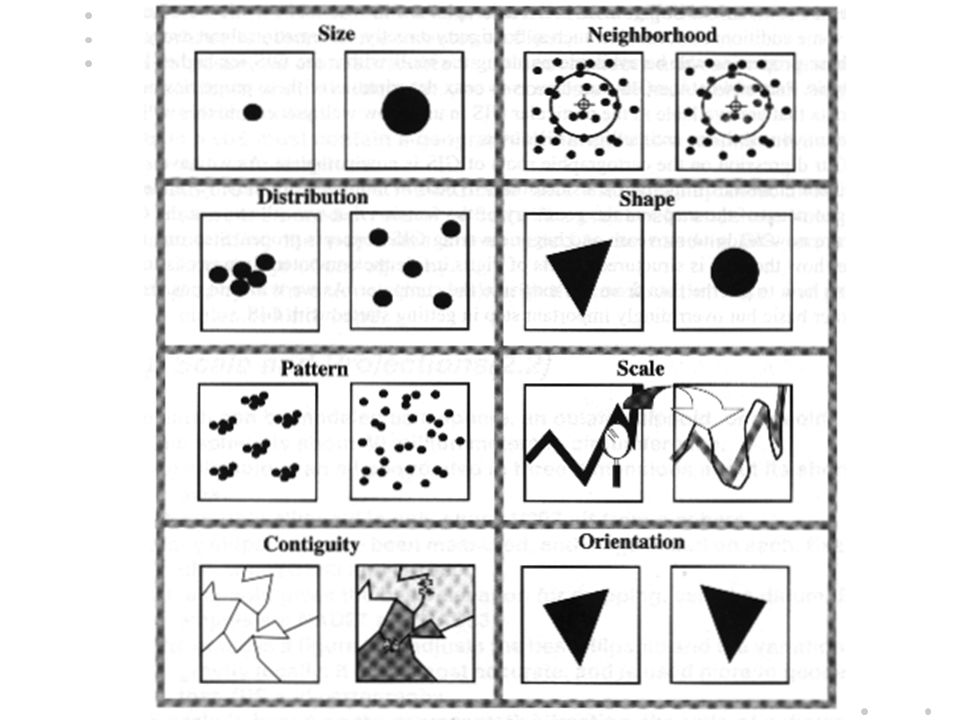
How does a map communicate? Real word features are represented as points, lines, polygons, contours and symbols A map conveys a wide range of characteristics about the real world Size, length, distribution, patterns, contiguity, neighbourhood, space, shape and orientation

5
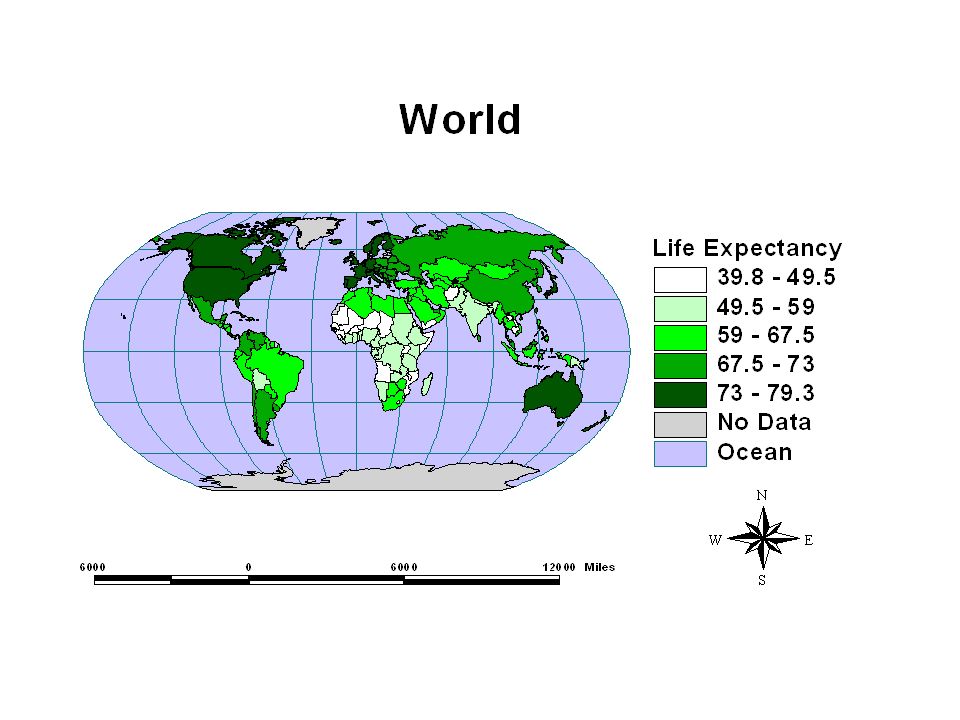
Thematic maps Perhaps we should say - What do maps communicate? Thematic means theme based and a map can graphically communicate the spatial variability in a wide range of possible themes - both human (socio-economic) and physical
 and physical.")
8
Thematic Maps Population, death-rate, income levels etc are dynamic themes of data that will change rapidly Soils, geology, ecological zones and political maps will remain fairly static Themes may be presented as different colours or dots/shading - or even small pie- charts overlaid onto a normal political map

9
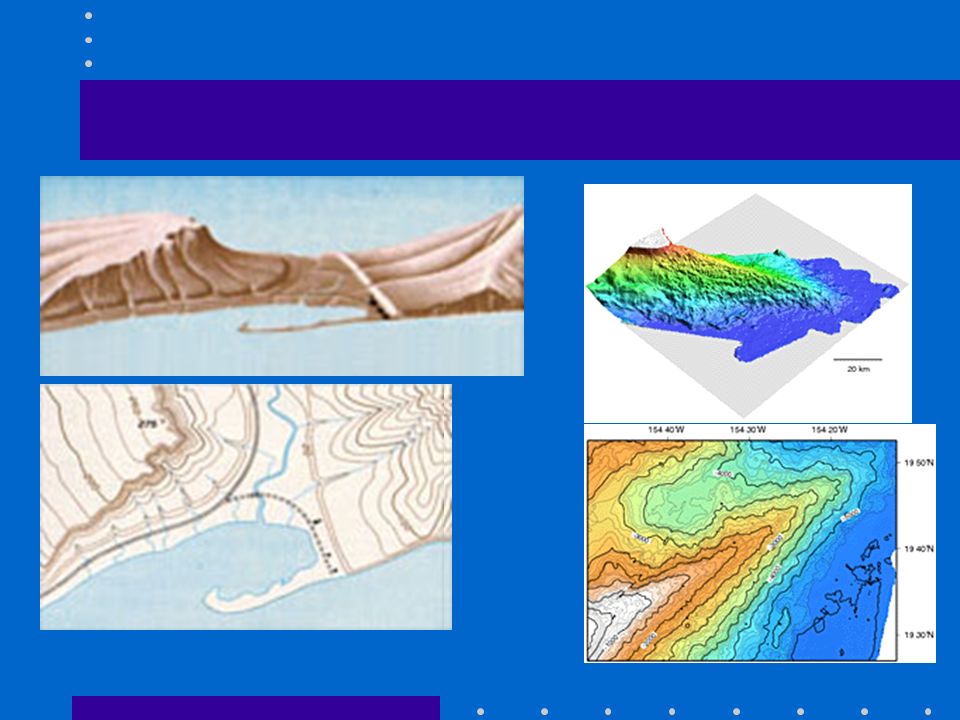
Topographic maps Contours show areas of equal height above mean sea-level (MSL) Contours close together represent steep changes in height - contours far apart show gradual change in height Contours use an interval (in metres) although not all contours may be labelled
 Contours close together represent steep changes in height - contours far apart show gradual change in height Contours use an interval (in metres) although not all contours may be labelled")
11
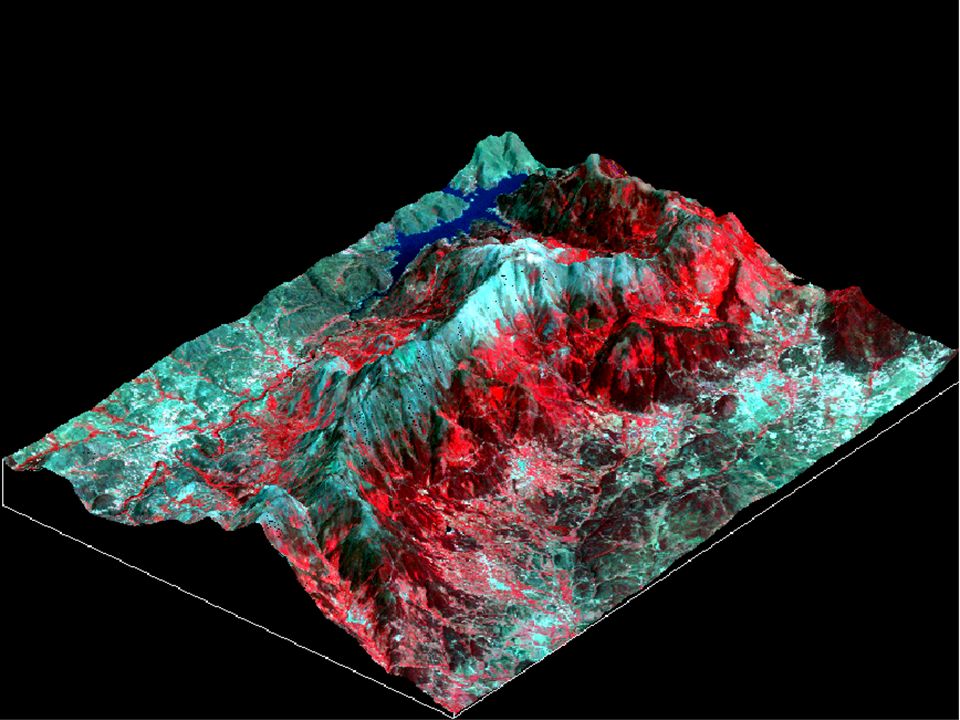
Using contour maps Locate the nearest line to your feature If not labelled, locate nearest labelled line and multiply number of contours away by the interval then add (or subtract) this value from the nearest labelled contour value An alternative to using contours is a 3- dimensional rendering of the surface
 this value from the nearest labelled contour value An alternative to using contours is a 3- dimensional rendering of the surface")
14
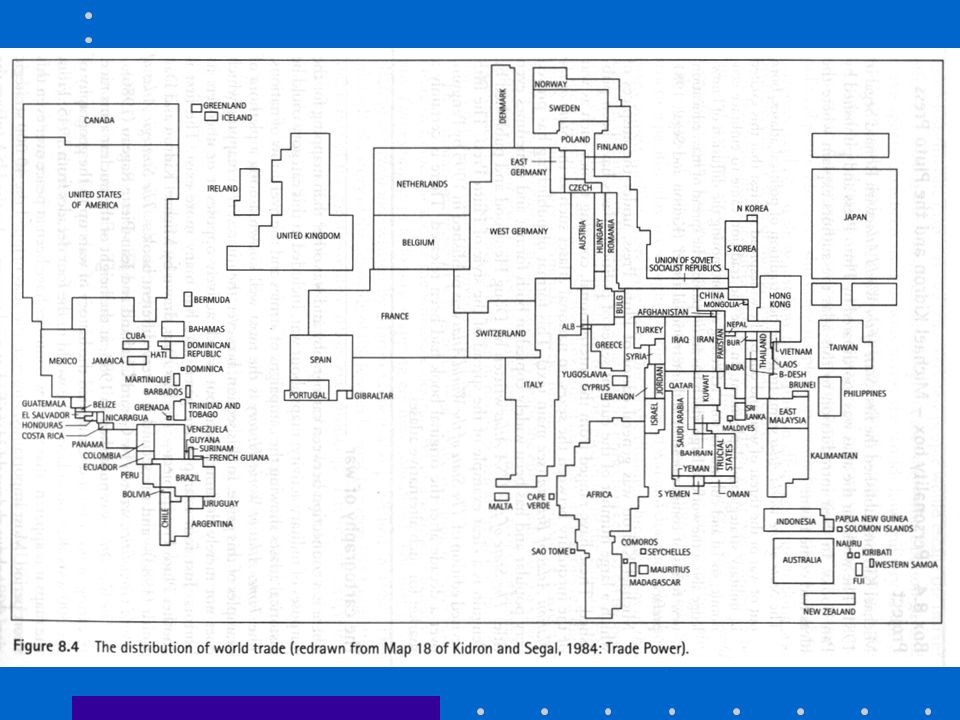
Abstract Maps Maps do not always have to be accurate in terms of their representation of reality Maps can be abstract and may represent features of the real world in an ethereal way Maps can be used to suggest connections, principles or ideas that bear no parallel in reality. Such en entity is known as a cartogram

18
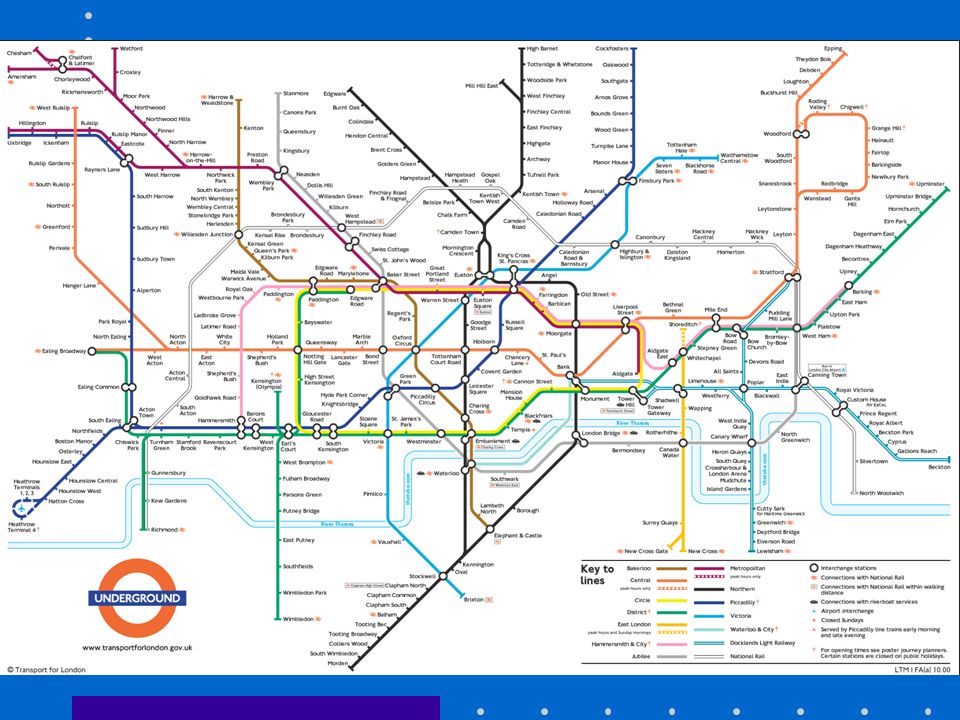
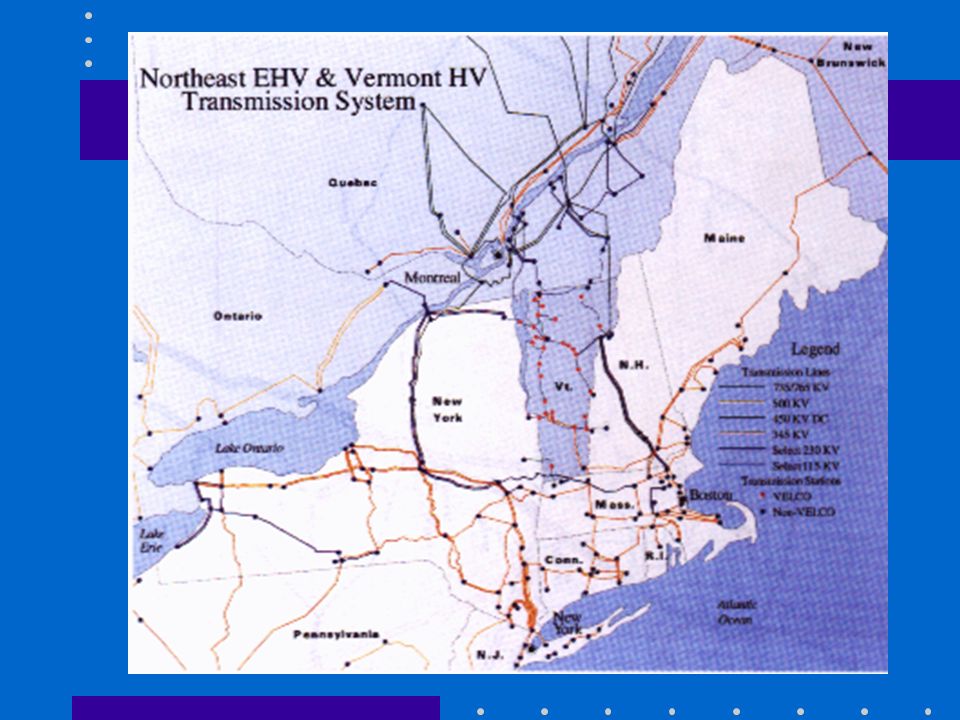
Abstract maps Any kind of information can be communicated by a map Just as the London Underground was designed by an electronics draughtsman (Beck) in the 1920s, maps can be used to show power distribution - using clever abstraction and use of symbols
 in the 1920s, maps can be used to show power distribution - using clever abstraction and use of symbols")
20
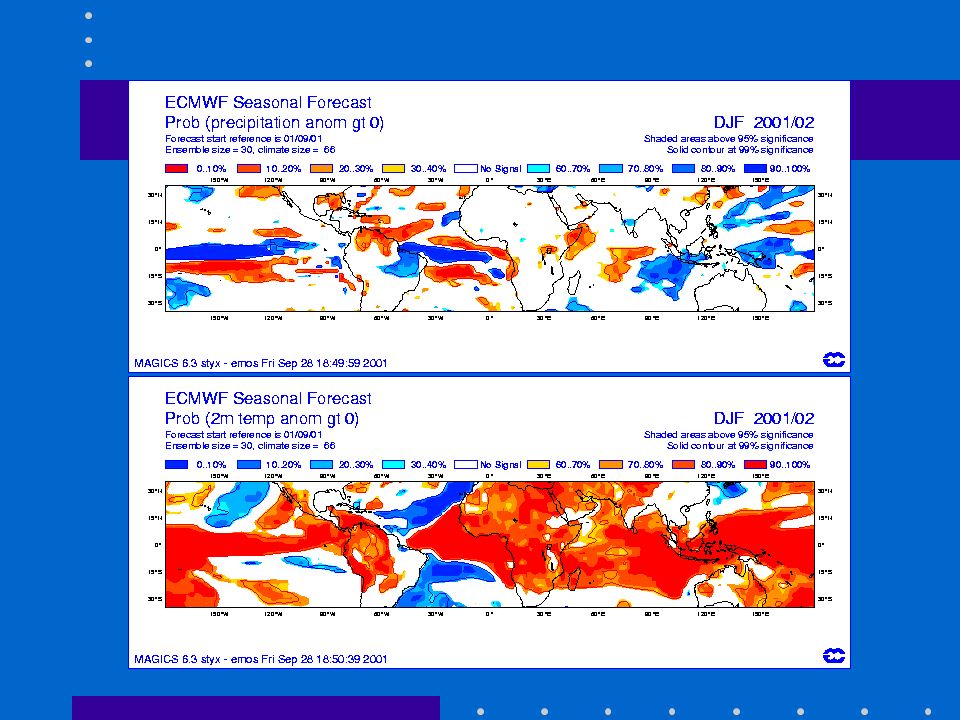
Abstract maps Maps can also be used to provide a graphical representation of forecasts A map of a forecast variable (rainfall or temperature) is interesting as no such feature actually exists in reality.
 is interesting as no such feature actually exists in reality.")
22
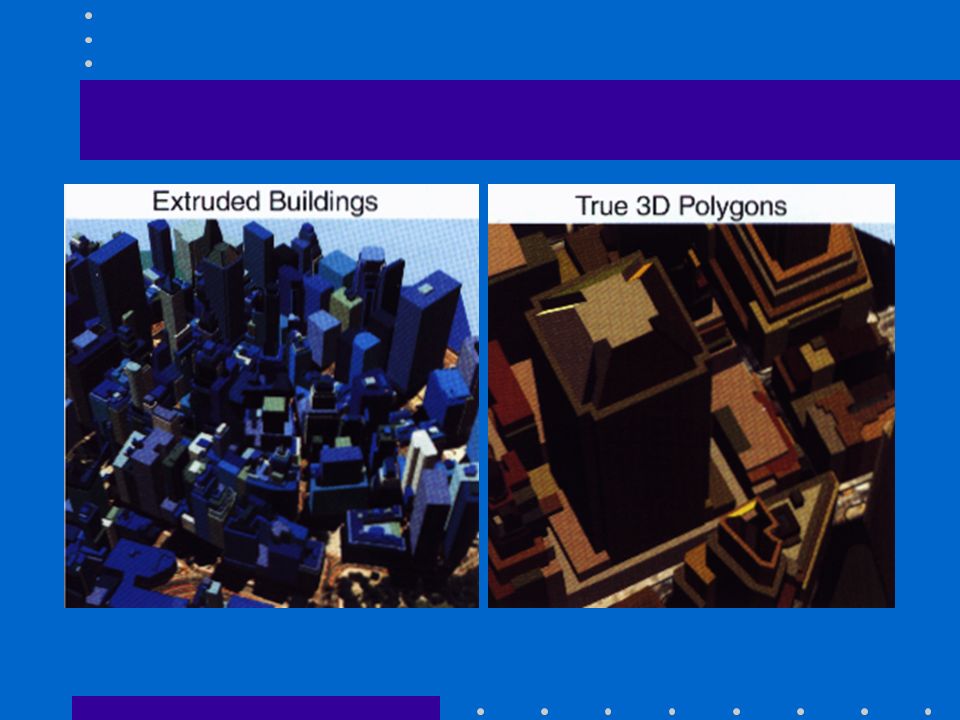
Abstract Maps Maps do not have to be 2 dimensional Detailed surveys of towns and cities have allowed computer generated 3-dimensional renderings to be generated

24
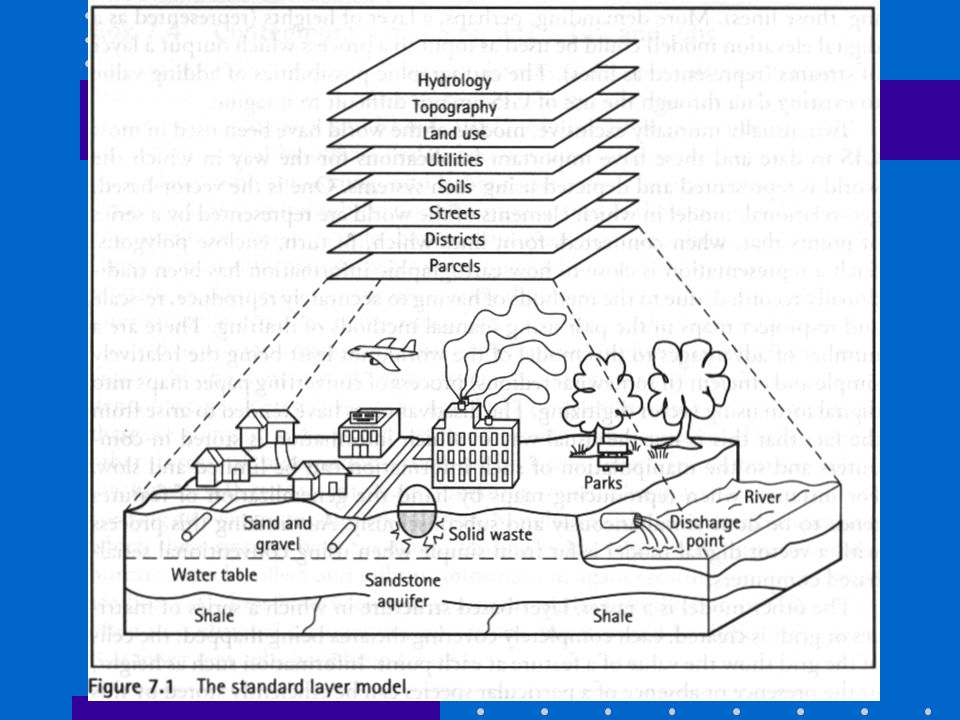
GIS Geographical Information System (GIS) A GIS allows layers of spatially referenced information to be combined as though they were transparent slides A GIS can drill down through these layers to perform calculation, scenarios and model solutions to complex problems
 A GIS allows layers of spatially referenced information to be combined as though they were transparent slides A GIS can drill down through these layers to perform calculation, scenarios and model solutions to complex problems")
26
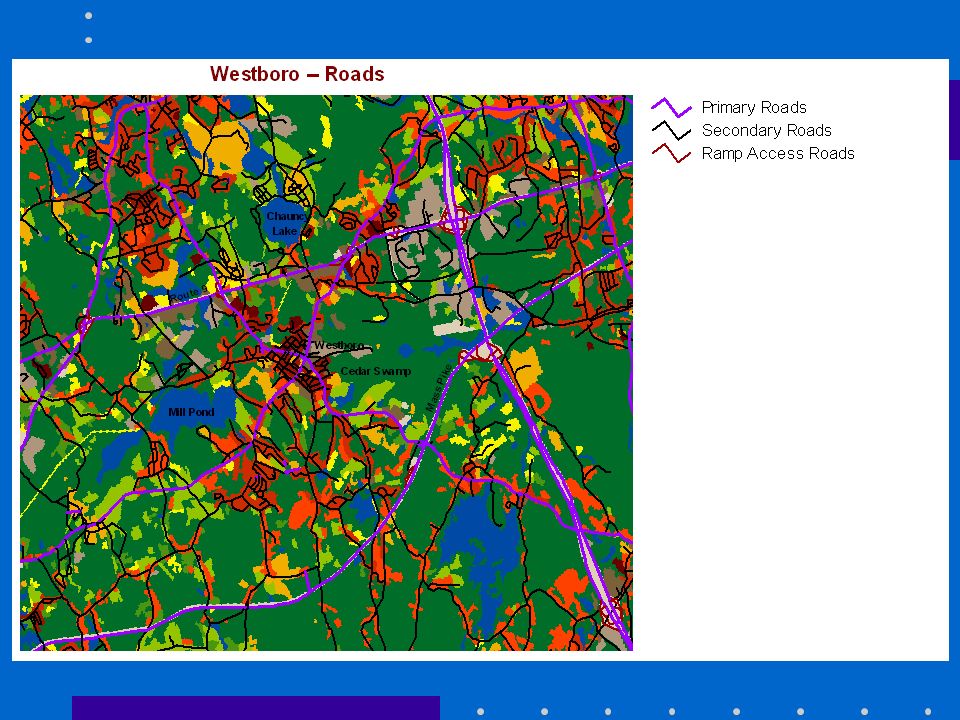
GIS A GIS must have a spatial reference framework. This can be latitude/longitude, Ordnance Survey grid, postcodes etc A GIS operates entirely within a computer system VECTOR features are represented as POINTS, LINES and POLYGONS

28
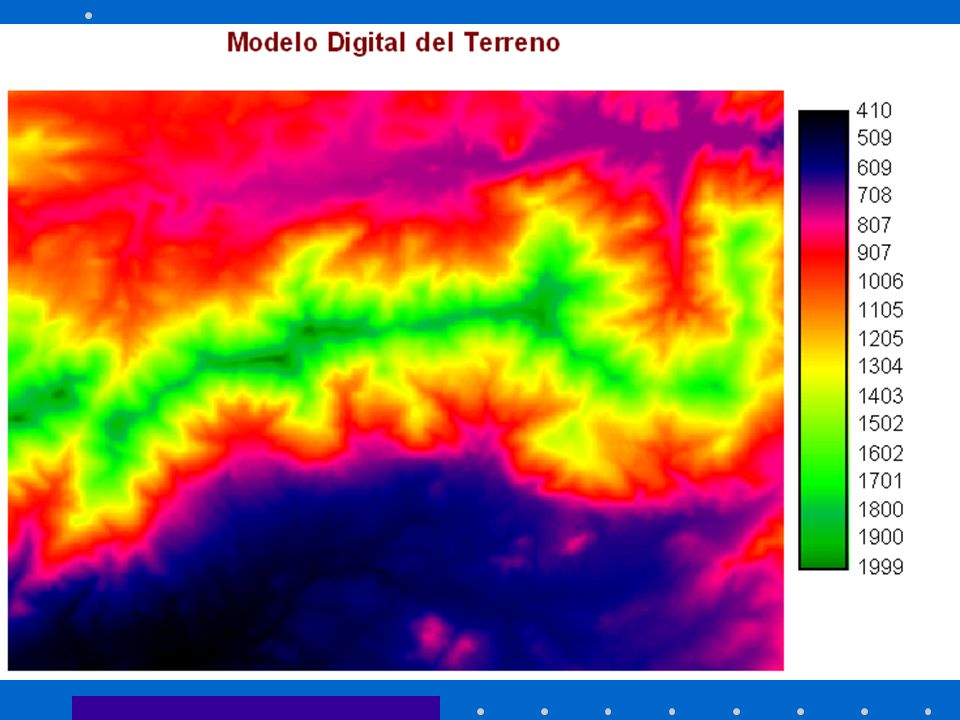
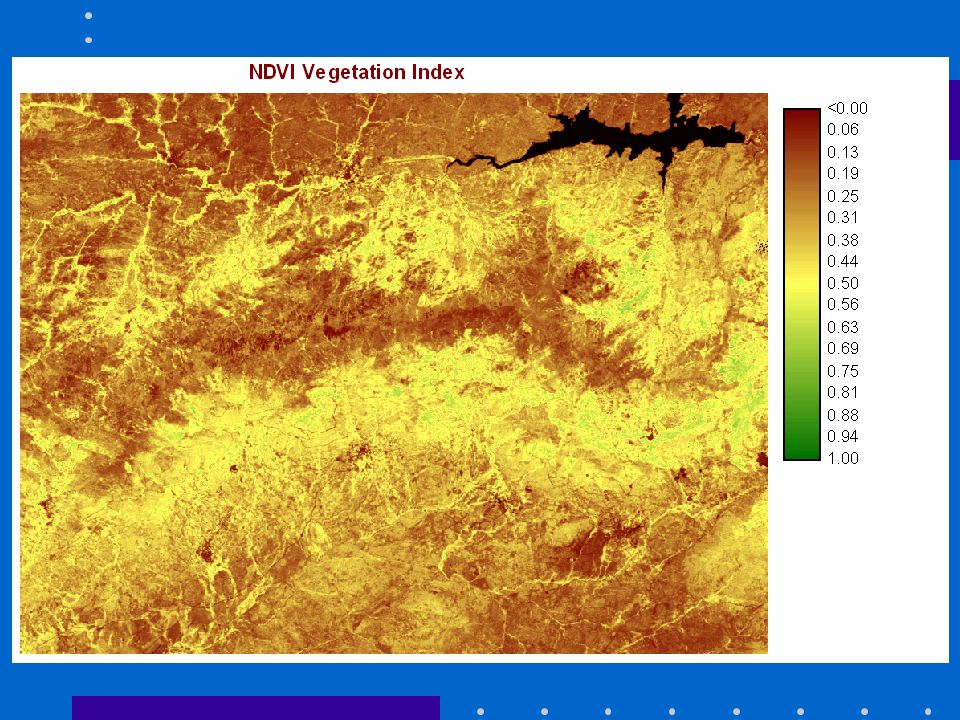
GIS Some map data is continuous and is created from pixels. This type of data is known as RASTER data Raster data can be derived from satellite (rainfall, vegetation or a an aerial photograph) Raster data can be used in complex environmental models
 Raster data can be used in complex environmental models.")
31
GIS Can be used for real-time applications Vector data stores metadata relating to any conceivable statistic in a separate database file that is spatially referenced within the map Raster data encodes continuous data as pixel values for a range of remotely sensed information

32
Suggested Reading Mapping: ways of representing the world by Dorling and Fairbairn, 1997 ESRI map book. Implementing concepts of Geography. Volume 14, 1999 Getting started with Geographical Information Systems by Clarke K., 1997

33
PRACTICAL: Today Groups A2, B1 & B2 (2pm – 3:30pm) A1, C1 & C2 (3:30pm – 5pm) Loxford: L106
 A1, C1 & C2 (3:30pm – 5pm) Loxford: L106")
Similar presentations


? A GIS is a particular form of Information System applied to geographical.>")


