Download presentation
Presentation is loading. Please wait.

1
McCreary Centre Society www.mcs.bc.ca

2
Administration took place in Grade 7-12 classes in 50 of the 59 BC School Districts. Over 29 000 surveys were collected in 1,760 classrooms between February and June 2008. North Vancouver Island “I am happy to see a survey like this one. It’s about time questions were being asked. Now I am hoping to see some positive actions.” BC Youth Participant

3
A Picture of Health www.mcs.bc.ca

4
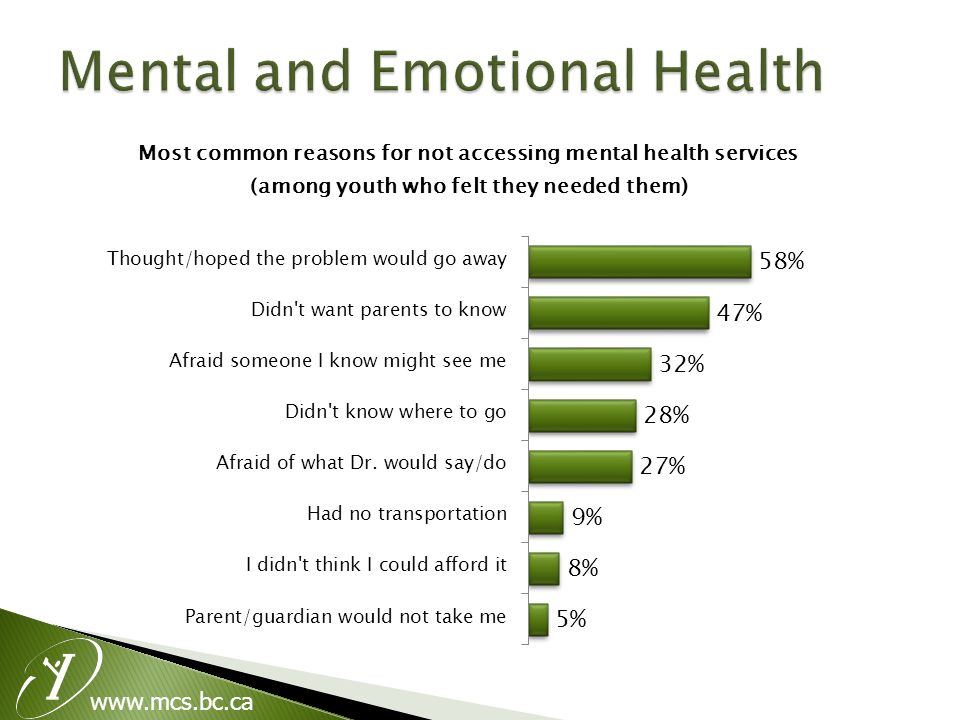
Most students are doing well; nearly all 84% report good or excellent health Serious injuries have declined 18% of females, 7% of males did not get mental health services they needed At least half of youth did not eat the recommended servings of fruits or vegetables yesterday

5
www.mcs.bc.ca No change in physical activity: only 1 in 4 males, 1 in 10 females exercise every day Suicidal thoughts and suicide attempts are lower for the first time since 1992 More than 1 in 5 females, 1 in 10 males reported deliberate self-harm

6
www.mcs.bc.ca Far fewer youth smoke than a decade ago, and those who do started at older ages Alcohol and marijuana use lower Fewer students had ever used cocaine, amphetamines, or mushrooms, continuing declines since 1998 But use of some other drugs, including hallucinogens like LSD, rose

7
www.mcs.bc.ca Relationship violence is unchanged since 2003; 9% of males, 6% of females Pregnancy rates also stable, less than 2% Reversing trends in physical and sexual abuse, after declines since 1992 Protective factors can help even the most vulnerable youth overcome risks

8
www.mcs.bc.ca Most BC teens are doing well, and report healthier behaviours than students 10 years ago

9
North Vancouver Island – A Picture of Health www.mcs.bc.ca

10
Ethnic or Cultural background (Youth could mark all that apply) European66% Aboriginal/First Nations18% East Asian4% Latin/South/Central American3% South East Asian2% African2% Australian/Pacific Islander2% South Asian2% Other (excluding Canadian)2% Don’t know18%
 European66% Aboriginal/First Nations18% East Asian4% Latin/South/Central American3% South East Asian2% African2% Australian/Pacific Islander2% South Asian2% Other (excluding Canadian)2% Don’t know18%")
11
www.mcs.bc.ca Who youth live with most of the time? (Youth could mark all that apply) Mother87% Father64% Stepfather9% Other adults related to me 5% Stepmother3% Other adults not related to me 2% Do not live with any adults 1%
 Mother87% Father64% Stepfather9% Other adults related to me 5% Stepmother3% Other adults not related to me 2% Do not live with any adults 1%.")
12
North Vancouver Island– A Picture of Health www.mcs.bc.ca

13
84% reported good or excellent health. 11% of youth reported a debilitating health condition or disability.

14
www.mcs.bc.ca 15% of youth did not get medical help when they felt they needed it.

15
www.mcs.bc.ca 32% of students were injured seriously enough in the past year to need medical attention.

16
www.mcs.bc.ca Injury Prevention 66% of youth always wore a seatbelt. 26% of students always wore a helmet while bike riding.

17
www.mcs.bc.ca What youth ate and drank yesterday No Yes, once Yes, twice or more Water7%22%72% Milk, cheese, yogurt9%37%54% Fruit15%43%42% Green salad or vegetables 23%47%30% Cookies, cake, donuts, chocolate bars 35%48%16% Pizza, hot dogs, potato chips, French fries 50%39%11% Pop/soda58%30%12% Hot or cold coffee or coffee-based drinks 70%21%10% Energy drinks85%11%4% Note: Percentages do not always total 100% due to rounding. At least 49% of youth fell short of the recommended daily portions of fruits and vegetables

18
www.mcs.bc.ca

19
20% of male youth were very satisfied with their body image, compared to only 10% of females.

20
www.mcs.bc.ca

21
North Vancouver Island – A Picture of Health www.mcs.bc.ca

27
North Vancouver Island– A Picture of Health www.mcs.bc.ca

28
70% of youth never had sexual intercourse (lower than provincial rate: 78%) Most common reasons for not having sex: Waiting to meet the right person (48%) Not ready for sex (45%) Not wanting to get pregnant or cause pregnancy (38%) Among those who had sex: Most commonly started between age 14-16 24% first had sex before age 14
 Most common reasons for not having sex: Waiting to meet the right person (48%) Not ready for sex (45%) Not wanting to get pregnant or cause pregnancy (38%) Among those who had sex: Most commonly started between age 24% first had sex before age 14")
29
www.mcs.bc.ca

30
Birth control method used last time youth had sex: Condoms: 64% Birth control pills: 50% Only withdrawal: 4% Emergency contraception: 3% No method: 4% 9% of sexually active students have been pregnant or caused a pregnancy

31
North Vancouver Island– A Picture of Health www.mcs.bc.ca

32
† Indicates that the difference between 2003 and 2008 North Vancouver Island estimates was statistically significant

33
North Vancouver Island– A Picture of Health www.mcs.bc.ca

34
†Difference between North Vancouver Island and provincial estimates was statistically significant

35
www.mcs.bc.ca † Difference between 2008 North Vancouver Island and provincial estimates was statistically significant

36
www.mcs.bc.ca North Vancouver Island BC Prescription pills17%15% Any hallucinogens12%9% † Mushrooms13%8%† Cocaine6%4% Inhalants5%4% Any amphetamines4%3%† Steroids2% Heroin2%1% Injected an illegal drug2%1% † Difference between 2008 North Vancouver Island and provincial estimates was statistically significant

37
North Vancouver Island – A Picture of Health www.mcs.bc.ca

39
Internet Safety ◦ 16% had been in contact with someone who made them feel unsafe Relationship Violence ◦ 8% of male and female students reported that their partner hit, slapped or hurt them in the past month Discrimination ◦ 20% experienced discriminations due to their physical appearance

40
North Vancouver Island– A Picture of Health www.mcs.bc.ca

41
63% of students liked school “somewhat” Females more likely than males to like school “very much” (22% vs. 14%) 33% skipped at least one full day of school
 33% skipped at least one full day of school.")
42
www.mcs.bc.ca

43
North Vancouver Island– A Picture of Health www.mcs.bc.ca

47
North Vancouver Island – A Picture of Health www.mcs.bc.ca

48
Having protective factors in their lives can promote health and reduce the negative effect of some risk behaviors. Protective factors in AHS School (e.g., school connectedness) Family (e.g., family connectedness) Community Connected to culture/ethnic group Youth engagement in activities Peer prosocial attitudes about risky behaviors
 Family (e.g., family connectedness) Community Connected to culture/ethnic group Youth engagement in activities Peer prosocial attitudes about risky behaviors.")
49
www.mcs.bc.ca

52
A Picture of Health www.mcs.bc.ca

53
84% reported that their health was good or excellent 32% of students in this area were injured seriously enough to need medical attention 15% of local youth did not get medical help when they felt they needed it

54
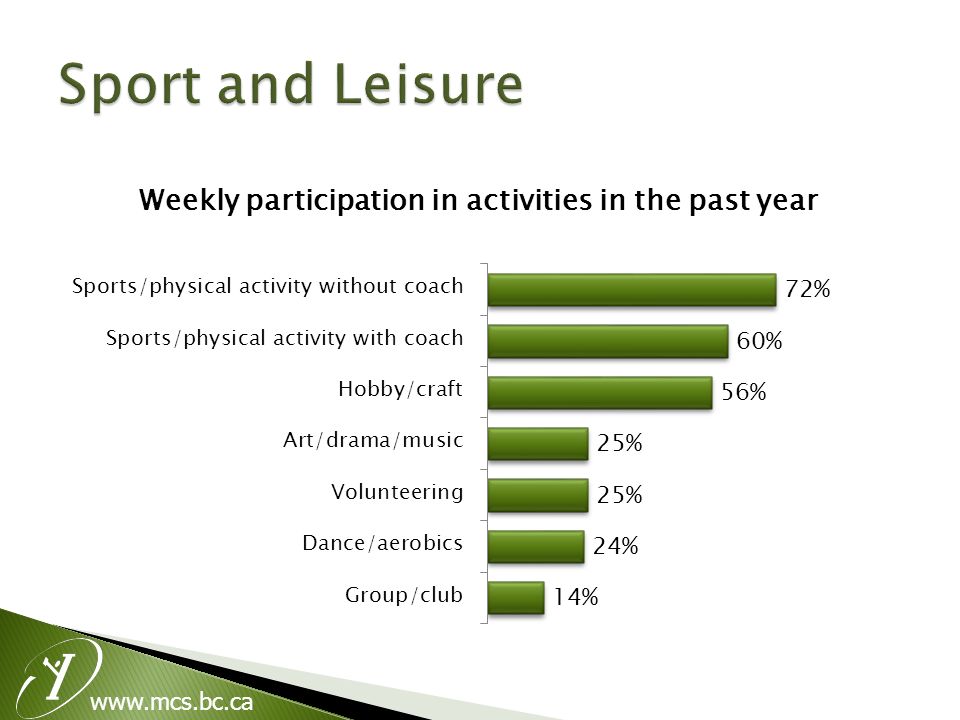
www.mcs.bc.ca For many sport and exercise activities, participation rates did not differ between this area and the province a whole Among youth who were at a healthy weight, 53% of females were trying to lose weight and 30% of males were trying to gain weight The majority of youth in this area reported high self-esteem

55
www.mcs.bc.ca 7% of students attempted suicide in the past year Students were more likely than those across the province to have tired alcohol, marijuana, or tobacco Majority of youth reported never having sexual intercourse (70%)
")
56
www.mcs.bc.ca 24% had experienced either physical or sexual abuse and 7% had experienced both types of abuse 16% of students in this area had been in contact with someone on the Internet who made them feel unsafe Being connected to their family, school or cultural group and being engaged in extracurricular activities were associated with lower risk of suicidal ideation

57
A Picture of Health

58
www.mcs.bc.ca 14 regional reports at HSDA level Additional in-depth topic reports (e.g., substance use) Fact sheets on key topics ‘Next Steps’ workshops and other resources for youth
 Fact sheets on key topics ‘Next Steps’ workshops and other resources for youth")
59
www.mcs.bc.ca McCreary Centre Society 3552 East Hastings Street Vancouver V5K 2A7 mccreary@mcs.bc.ca 604 291 1996

Similar presentations


 Pollard Middle School 2004 Student Risky Behaviors.>")


 Middle School Survey Percentage of students who never or rarely.>")


