Download presentation
Presentation is loading. Please wait.

2
Syllabus Content for Core 1

3
1. Define Carrying capacity 2. What is the carrying capacity of our classroom? 3. What is the carrying capacity of your home? 4. What kinds of problems arise when carrying capacity is exceeded by population and/or consumption by the limited population?

4
Pop. J- Chart J-Chart … Why is it called this? How long did it take the population of the world to reach 1 billion? ○ 1800 Have the time intervals for doubling the population changed (doubling time)? Where are most of the world’s new inhabitants coming from? AKA core and periphery
. Where are most of the world’s new inhabitants coming from. AKA core and periphery.")
5
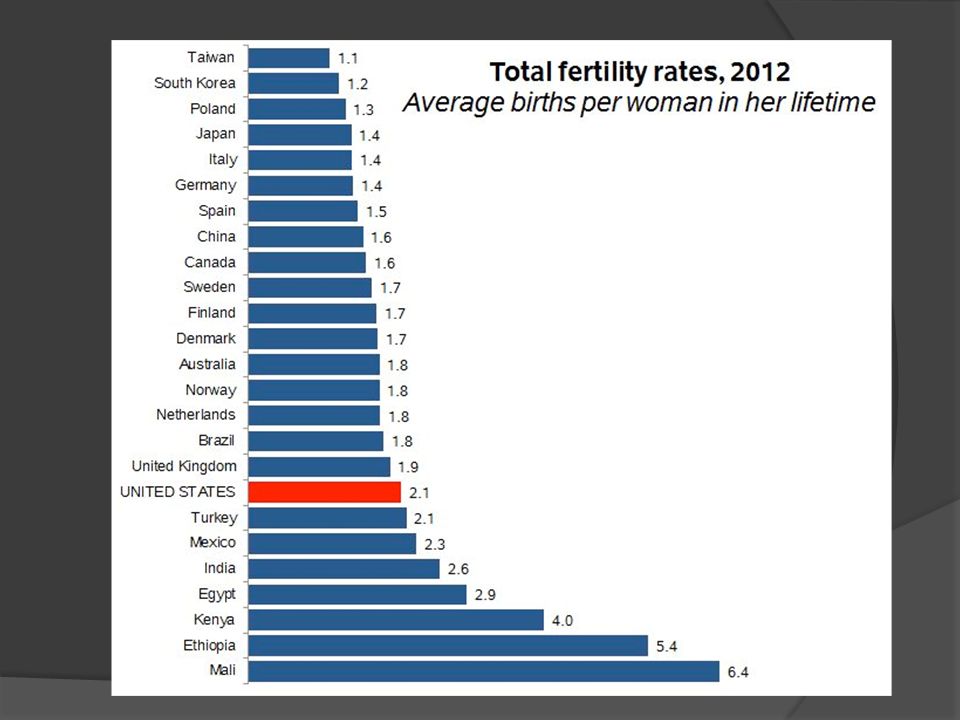
From the Vocab What’s the reason for the population increase? What are birth rates (crude birth rates)? What are death rates (mortality rates)? Natural change = #Births - # deaths Total Population change = #births – #deaths + #net migration … net migration (M) = immigration (inside) – emigration (out, exit) P= B-D +/- M Infant and child mortality rates? Infant = Child = Fertility rate? vs. total fertility rate? See table 4, pg. 10 in book Life expectancy? Rate of natural increase? Replacement level fertility?
. What are death rates (mortality rates). Natural change = #Births - # deaths Total Population change = #births – #deaths + #net migration … net migration (M) = immigration (inside) – emigration (out, exit) P= B-D +/- M Infant and child mortality rates. Infant = Child = Fertility rate. vs. total fertility rate. See table 4, pg. 10 in book Life expectancy. Rate of natural increase. Replacement level fertility .")
6
TFR =.3481*5=1.74

7
44 What might cause fertility rates to decline?

9
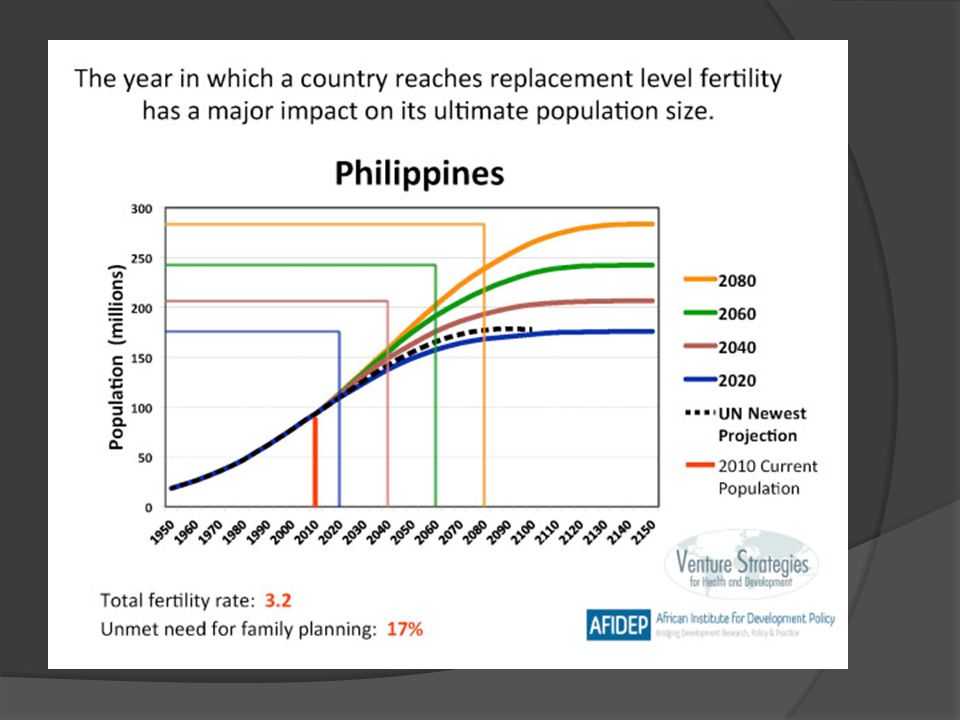
Population Momentum Population momentum refers to population growth at the national level that would occur even if levels of childbearing immediately declined to replacement level. For countries with above-replacement fertility (greater than 2.1 children per woman), population momentum represents natural increase to the population. It takes generations to move through and die off for population growth to subside
, population momentum represents natural increase to the population. It takes generations to move through and die off for population growth to subside.")
11
Demographic Transition Model (DTM) of the Developed World Developed World Developing World Underdeveloped World (primitive societies Time – Ancient to Modern Height of Industrial Revolution & Urbanization in Western Societies (1800’s) Agricultural Revolution in England(1700’s)
 of the Developed World Developed World Developing World Underdeveloped World (primitive societies Time – Ancient to Modern Height of Industrial Revolution & Urbanization in Western Societies (1800’s) Agricultural Revolution in England(1700’s)")
12
Demographic Transition (DTM) in Developing World See pg. 8 in the book Many places in developing world, birth rates were already much higher, so too were death rates in stage 1 Advancement of western medicine & technology through physical and economic colonization brings about rapid reduction in death rate… though pandemics like AIDS and Ebola can change this for some countries Some countries like India and China had high population bases to begin with Fall in fertility has been steeper and more rapid in many developing countries.

13
Population Pyramids Why is this called a population pyramid? They present info. on age-sex structure of a society Ea. bar represents a cohort of 5 years

14
US Population Pyramid

15
Mexico & China

16
Nigeria & France

17
India

18
1. Can you tell population size on pyramids with only percentages graphed? 2. Of the six graphs (Mexico, India, Nigeria, China, France, and US), which look most like pyramids? 3. What does that indicate about their population growth rates? 4. What factors would change the shape of the pyramids in the future? 5. Looking at the pyramids, which country appears to have the slowest rates of population growth? How can you tell? 6. In which countries do children make up the biggest percentage of the population? 7. Some cultures have traditionally favored boy children over girl children (as can been seen in the pyramids for India and China). Why might it be advantageous to have boys rather than girls in these countries? What are some consequences that may arise if a generation has a gender imbalance? 8. If you had a business in Nigeria and wanted to capitalize on your information about the Nigerian population, what would you sell? 9. How would you expect the Mexican pyramid to look if you graphed it in 40 years from now?
, which look most like pyramids. 3. What does that indicate about their population growth rates. 4. What factors would change the shape of the pyramids in the future. 5. Looking at the pyramids, which country appears to have the slowest rates of population growth. How can you tell. 6. In which countries do children make up the biggest percentage of the population. 7. Some cultures have traditionally favored boy children over girl children (as can been seen in the pyramids for India and China). Why might it be advantageous to have boys rather than girls in these countries. What are some consequences that may arise if a generation has a gender imbalance. 8. If you had a business in Nigeria and wanted to capitalize on your information about the Nigerian population, what would you sell. 9. How would you expect the Mexican pyramid to look if you graphed it in 40 years from now .")
19
Relationship of Demographic Transition to Pop. Pyramids

20
Italy stats & Pyramid

21
Rwanda stats & Pyramid

22
UK Stats & Pyramid

23
India Stats & Pyramid

24
Let’s Summarize Factors that Affect Population Growth 1.Modern medicine and hygiene 2.Education (especially women’s education) 3.Industrialization and urbanization (how tech. savvy is the place) 4.Economic development (do people have enough, steady work) 5.Government policy 6.Role of women in society (do they stay at home or work)
 4.Economic development (do people have enough, steady work) 5.Government policy 6.Role of women in society (do they stay at home or work).")
Similar presentations


>")