Download presentation
Presentation is loading. Please wait.

1
3.1.4 Demographic Transition

2
Demographic Transition 2.5 2.0 1.5 1.0 0.5 0.0 19501960197019801990200020102020203020402050 0 2 4 6 8 10 Growth rate (percent) Population in billions Year Less developed countries More developed countries
 Population in billions Year Less developed countries More developed countries")
3
Why has the world’s population grown at such different rates throughout history? Natural increase = births – deaths Net migration = immigrants – emigrants Births Deaths Migration

4
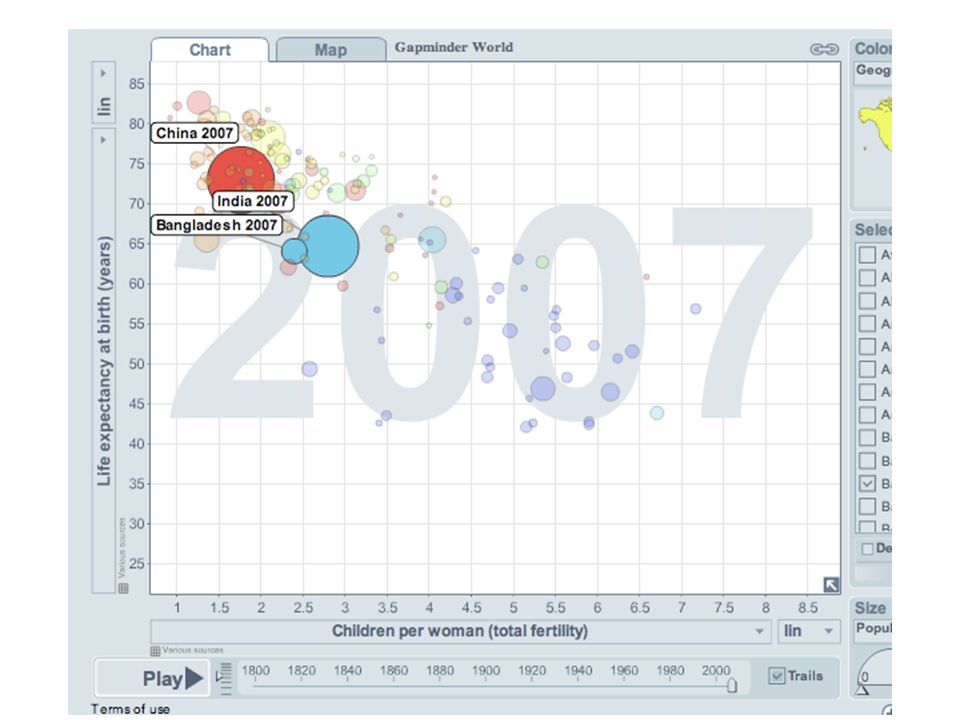
What affects birth rates? Fertility Rates Replacement level fertility = # of children a couple needs to produce to replace themselves Total fertility rate = estimate of the average # of children a woman will produce during her childbearing years (15-49)
.")
5
Births per woman < 2 2-2.9 3-3.9 4-4.9 5+ No Data Fertility Rates

7
What affects fertility rates? Importance of children to labor force Urbanization Cost of raising and educating children Education and employment options for women Average age of marriage Availability of pension plans Availability of legal abortions Availability of birth control Religious beliefs, traditions and culture

8
What affects death rates? Higher food supplies Better nutrition Improved medical and health technology Improved sanitation Safer water supplies

9
Indicators of overall health Growth = natural increase – net migration Life expectancy Infant mortality **

10
Infant deaths per 1,000 live births <10 <10-35 <36-70 <71-100 <100+ Data not available

11
Population (2002) Population projected (2025) Infant mortality rate Life expectancy Fertility rate (TFR) %Population under age 15 % Population over age 65 Per capita GNI PPP (2000) 288 million 174 million 130 million 346 million 219 million 205 million 6.8 33 75 77 years 69 years 52 years 2.1 2.2 5.8 21% 33% 44% 13% 5% 3% $34,100 $7,300 $800 United States (highly developed) Brazil (moderately developed) Nigeria (less developed) © 2004 Brooks/Cole – Thomson Learning
 Population projected (2025) Infant mortality rate Life expectancy Fertility rate (TFR) %Population under age 15 % Population over age 65 Per capita GNI PPP (2000) 288 million 174 million 130 million 346 million 219 million 205 million years 69 years 52 years % 33% 44% 13% 5% 3% $34,100 $7,300 $800 United States (highly developed) Brazil (moderately developed) Nigeria (less developed) © 2004 Brooks/Cole – Thomson Learning")
12
Developed Countries 50 40 30 20 10 0 1775 1800 185019001950 2000 2050 Rate per 1,000 people Year Rate of natural increase Crude birth rate Crude death rate Rate of natural increase = crude birth rate – crude death rate © 2004 Brooks/Cole – Thomson Learning

13
Developing Countries 50 40 30 20 10 0 1775 1800 185019001950 2000 2050 Rate per 1,000 people Crude birth rate Rate of natural increase Crude death rate Year © 2004 Brooks/Cole – Thomson Learning

14
How can economic development help reduce birth rates? Demographers have developed a hypothesis known as the DEMOGRAPHIC TRANSITION. It states that as countries become industrialized, first death rates go down and then their birth rates decline.

15
4 stages of Demographic Transition: 1.Pre-industrial: birth rate and death rate are both high = little growth.

16
2. Transitional: death rate falls due to improved living and birth rates stay high = rapid growth.

17
3. Industrial: fertility falls and closes gap between birth and death rates = low growth.

18
Low High Relative population size Birth rate and death rate (number per 1,000 per year) 80 70 60 50 40 30 20 10 0 Stage 1 Preindustrial Stage 2 Transitional Stage 3 Industrial Stage 4 Postindustrial Low growth rate Increasing growth rate Very high growth rate Decreasing growth rate Low growth rate Zero growth rate Negative growth rate Birth rate Total population Death rate Time 4. Post-industrial: birth rate falls below death rate = zero growth.

Similar presentations


 G. Tyler Miller’s.>")


 in a given year.>")


 Population size (N) -ideal habitat -maximum reproduction -unlimited resources Increase often.>")


