Download presentation
Presentation is loading. Please wait.

1
3-1 DEMOGRAPHY

2
Demography – the numerical study of the characteristics, trends, and issues of a population. Why do governments and businesses study demography? Population – the measure of the number of people who live in a specific place at a specific time. Populations change over time. For example, Canada: YEARPOPULATION 18673.5 MILLION 196720 MILLION 201233.5 MILLION Canada ranks 37 th as a country in population. (World – 7 billion)
.")
4
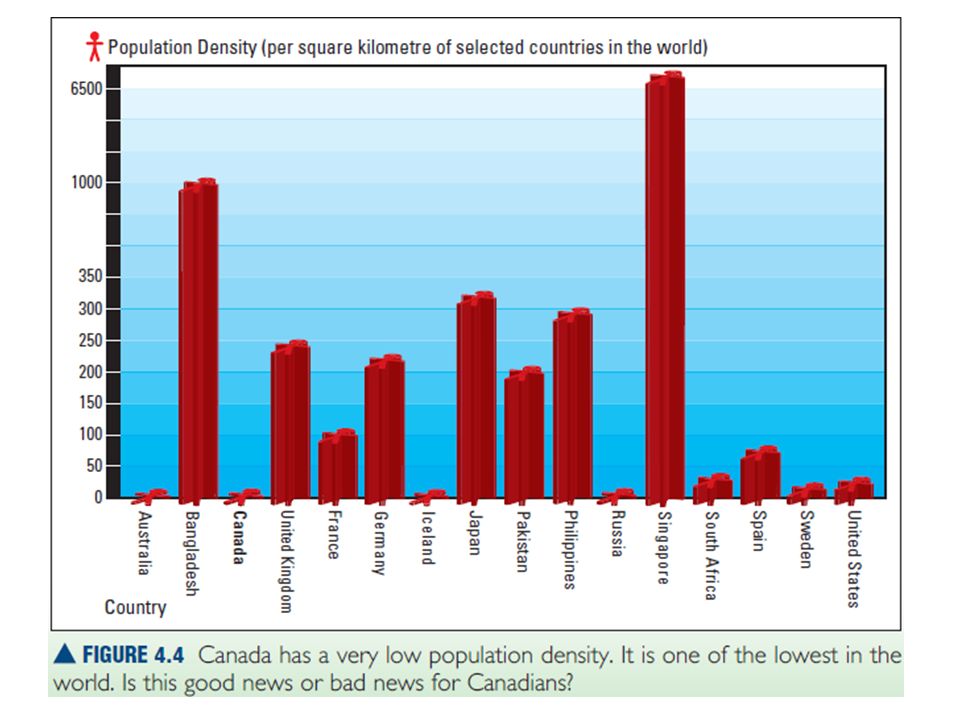
Population Density Population density – a measure of crowdedness. It tells how many people on average live in a square km. Population Density = population land area (km 2 ) What is the population density of Canada? 3 per km 2
 What is the population density of Canada. 3 per km 2.")
6
Every area of Canada does not have the same population density – it is an average. Population distribution – where people live, varies across the country, and within provinces and territories. Major cities like Toronto, Montreal, and Vancouver have a population density of 4000 per km 2.

7
Complete 3, 4 b, 5, 6, 7, 8 on page 161.

8
Population Change What factors cause a population to change? Birth Rate – the number of children born in an area for every 1000 inhabitants of that area. Death Rate – the number of people who die in an area for every 1000 inhabitants of that area. Natural Increase Rate - difference between the birth and death rate of a country. (NIR = BR – DR) (Natural change can be a negative #)
 (Natural change can be a negative #).")
9
Immigration – moving into a new country to live permanently. Immigration rate: Emigration – leaving a country of origin to live in another country. Emigration rate: Net Migration – The difference between the immigration and emigration rate.

10
Natural change – change in population involving births and deaths. NC = Births - Deaths Actual change - change in population involving births, deaths, immigration and emigration. AC = (B – D) + (I – E)
 + (I – E).")
11
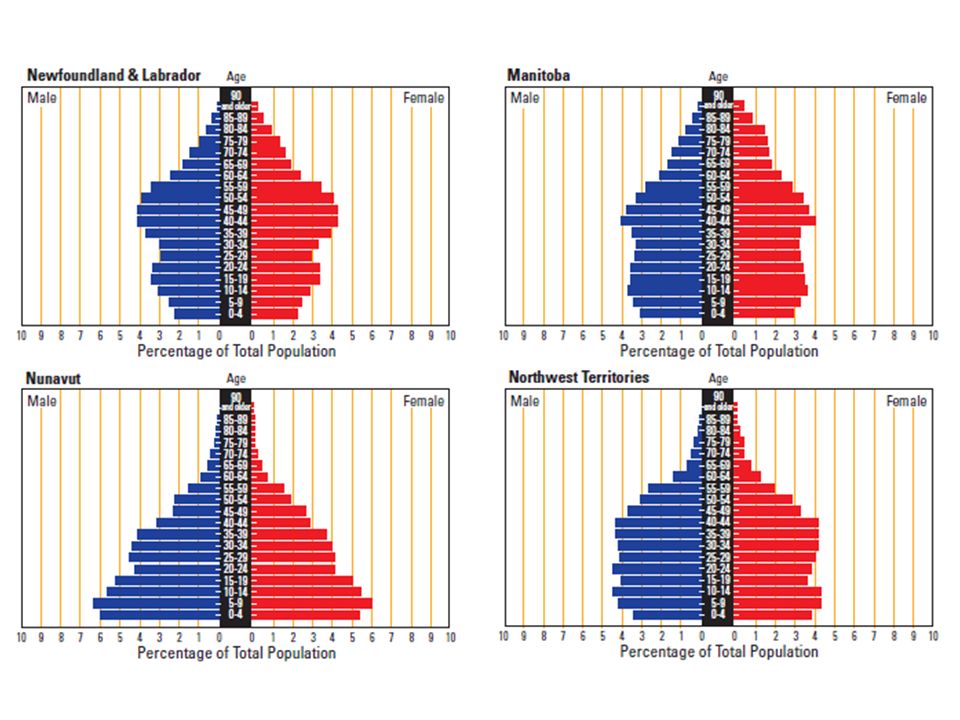
Title & Year Males-LEFTFemales-RIGHT Up by 1’s, 0 near origin! Up by 1’s, 0 near origin! Age groups… 0 - 4 at bottom!

12
Population Pyramids Population pyramid – a graph showing the population based on age groups and gender. The shape of the pyramid can reveal a lot about the population: Birth rate Death rate Male – Female ratio Seniors – Youth Ratio Growth Rate Anomalies

13
Expanding population - population is increasing - pyramid is wide at the bottom - high death rate (left) or decreasing (right)
 or decreasing (right)")
14
Contracting population - population is decreasing - low birth rate / low death rate - child-bearing age are not replacing themselves - bottom more narrow than middle Stable population - population is basically staying the same - declining birth rate / low death rate - child-bearing age groups are replacing themselves - middle is roughly the width of the bottom

15
Complete # 1 on page 173

Similar presentations


 and Immigration (people.>")


