Download presentation
Presentation is loading. Please wait.

1
Manhattan Catholic Schools Summary of Data for the Standards Assessment Report for Accreditation Cycle 2003-2008

7
Our scores on the ITBS Math Computation test showed a significant increase, from 32%, in 2003, to 50%, in 2007, of our students in grades 1-8 scoring at 75 to 100 in national percentile ranking. The number of students performing at the 0-25% range decreased from 9% to 3%. When we disaggregated these scores by ethnicity, it also showed an increase from 26 to 42% scoring in the top quartile and a decrease from 4% to 0% of these students scoring in the bottom quartile. We felt that the interventions we implemented for increasing the math computation levels in our school were highly effective and produced remarkable results. Our Kansas Math Assessment scores for grades 3-8 also showed an increase from 32%, in 2006, to 39%, in 2007, of our students performing at exemplary and a decrease from 3% (representing 6 students) to 2% (representing 4 students) of students performing at academic warning. The male students showed a significant increase from 26% in 2006 to 38% in 2007 performing at the exemplary level and the females showed an increase from 35% to 41% performing at exemplary. We hope this trend continues and all students will continue improving. We are pleased with this data and were proud that grades 3-7 made the State Standard of Excellence. The STAR Math scores showed 60% of our students in grades 2-8 scoring at 75 -100 th in percentile rank in both 2006 and 2007. There was a slight increase in both males and females performing at the 0-25th percentile rank over the same time period. Our local, curriculum embedded test, using the End of Year Harcourt Math test in grades 1-6, has been given for 2 years. The scores for students scoring at 90 – 100 percent correct, has decreased from 24%, in 2006 to 18% in 2007. It is noted that the greatest decrease at this level has occurred among the females. One of the reasons for this decrease is that this test is given at the end of the school year and students may be tired of testing. These results may also indicate that we need to be more mindful of how males and females store and retrieve information, as this test is a review of the entire year.
 to 2% (representing 4 students) of students performing at academic warning. The male students showed a significant increase from 26% in 2006 to 38% in 2007 performing at the exemplary level and the females showed an increase from 35% to 41% performing at exemplary. We hope this trend continues and all students will continue improving. We are pleased with this data and were proud that grades 3-7 made the State Standard of Excellence. The STAR Math scores showed 60% of our students in grades 2-8 scoring at th in percentile rank in both 2006 and There was a slight increase in both males and females performing at the 0-25th percentile rank over the same time period. Our local, curriculum embedded test, using the End of Year Harcourt Math test in grades 1-6, has been given for 2 years. The scores for students scoring at 90 – 100 percent correct, has decreased from 24%, in 2006 to 18% in It is noted that the greatest decrease at this level has occurred among the females. One of the reasons for this decrease is that this test is given at the end of the school year and students may be tired of testing. These results may also indicate that we need to be more mindful of how males and females store and retrieve information, as this test is a review of the entire year..")
13
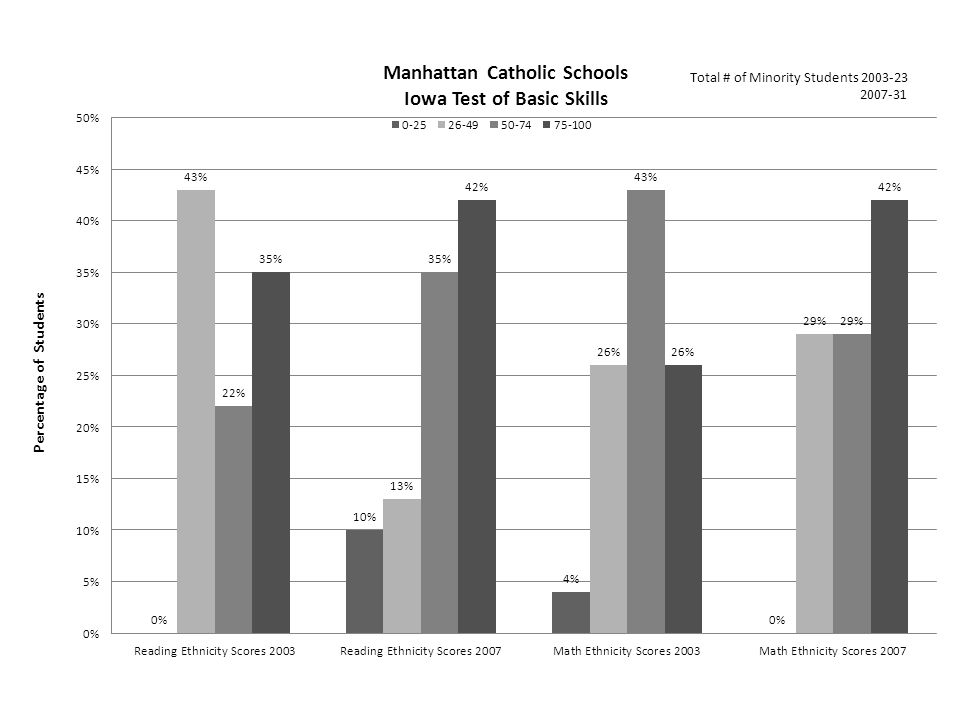
Our reading comprehension scores for grades 1-8 on the ITBS showed a significant increase from 51%, in 2003 to 59%, in 2007 of students in the 75 to 100 national percentile ranking. The percentage of students performing at the 0-25% ranking remained constant at 2%. When disaggregating by ethnicity, our 31 students showed an increase from 35%, in 2003, to 42%, in 2007, performing at the 75 to 100 percentile ranking, but also showed that we increased from 0 to 10% the number of students at 0-25 percentile rank. This is something we as a school will need to evaluate and monitor more closely. The Kansas Reading Assessments for grades 3-8 showed a significant increase from 40%, in 2006, to 49%, in 2007, of students performing at the exemplary level. We went from having 2 students performing at the academic warning level in 2006 to 1 student at this level in 2007. Our gender equity also showed that the males performing at exemplary increased from 34% to 42%, and the females increased from 46% to 56% performing at exemplary. We are very pleased with these results and were excited to have made the Standard of Excellence in grades 3-8 for the 2007 school year. In 2004, 57% of our students in grades 2-8 were at the 75 – 100 percentile rank on the STAR Reading Test, and in the spring of 2007, 61 percent of the students in grades 2-8 were at this same level, for an increase of 4%. There was a slight decrease from 6% to 5% of students performing at the 0-25 percentile ranking for this same time period. In 2005, we began to give a curriculum embedded reading comprehension end of the year test provided by Scott Foresman. In 2005, 53% of the students in grades 1-6 performed at 90 – 100 percent correct on this test, and in 2007, 48% of the students in grades 1-6 performed at that same level. This was a decrease although a total of 84% of the students performed at 80% and above in 2005 and 82% performed at this level in 2007. There was also a slight decrease, from 7% 9n 2005 to 6% in 2007 performing at the 0-69% correct level. The male students showed a greater drop in performance than the females. As a whole, we believe our interventions for reading were effective and our attention to evaluating the assessments throughout the year, reteaching struggling students, and using the correct vocabulary has greatly impacted our students reading comprehension.

16
Our 5 th and 8 th graders take the NCEA ACRE test each year to test their knowledge of religion. We graphed domain three which focused on liturgy. In 2003, 32% of the 5 th and 8 th graders scored in the advanced category. In 2007, 54% of the 5 th and 8 th graders scored in the advanced category, showing a significant increase. In 2003, 36% of these students were in the needs improvement category and in 2007, only 16% were in the needs improvement category. Grades 1-8 take a curriculum embedded (Silver Burdette) liturgy test at the end of each year. In 2005, 49% of our students were at the 90 – 100 percent correct category. In 2007, that number decreased slightly to 45%. There are 2 reasons for this decline. In 2007, the 8 th grade teacher did not give the religion test. The test was then administered to the Jr. High students when they came for various sports camps in the summer. Obviously they were not in the mood to test as all their results were poor. There were 11 Jr. High students who did not take the test. Because of these 2 things, we feel our data is not accurate and does not reflect the growth we expected to see after implementing our interventions.
 liturgy test at the end of each year. In 2005, 49% of our students were at the 90 – 100 percent correct category. In 2007, that number decreased slightly to 45%. There are 2 reasons for this decline. In 2007, the 8 th grade teacher did not give the religion test. The test was then administered to the Jr. High students when they came for various sports camps in the summer. Obviously they were not in the mood to test as all their results were poor. There were 11 Jr. High students who did not take the test. Because of these 2 things, we feel our data is not accurate and does not reflect the growth we expected to see after implementing our interventions..")
Similar presentations


 Needs Assessment (Why ) Improvement Plan (How) Implement and Monitor.>")


 Test Score Results b. Wilson School Annual Report Card 2. Breakdown of scores (Reading) 3. Breakdown.>")


