Download presentation
Presentation is loading. Please wait.

1
Quarterly HIV/AIDS Analysis for Michigan January 1, 2008 Michigan Department of Community Health HIV/STD/Viral Hepatitis and TB Epidemiology Section Division of Communicable Disease Bureau of Epidemiology

2
This estimate is calculated using several data sources, including: Persons who have not yet been tested Persons tested but not yet reported to MDCH Persons reported by name and living with HIV Persons reported by name and living with AIDS Estimate of HIV Prevalence

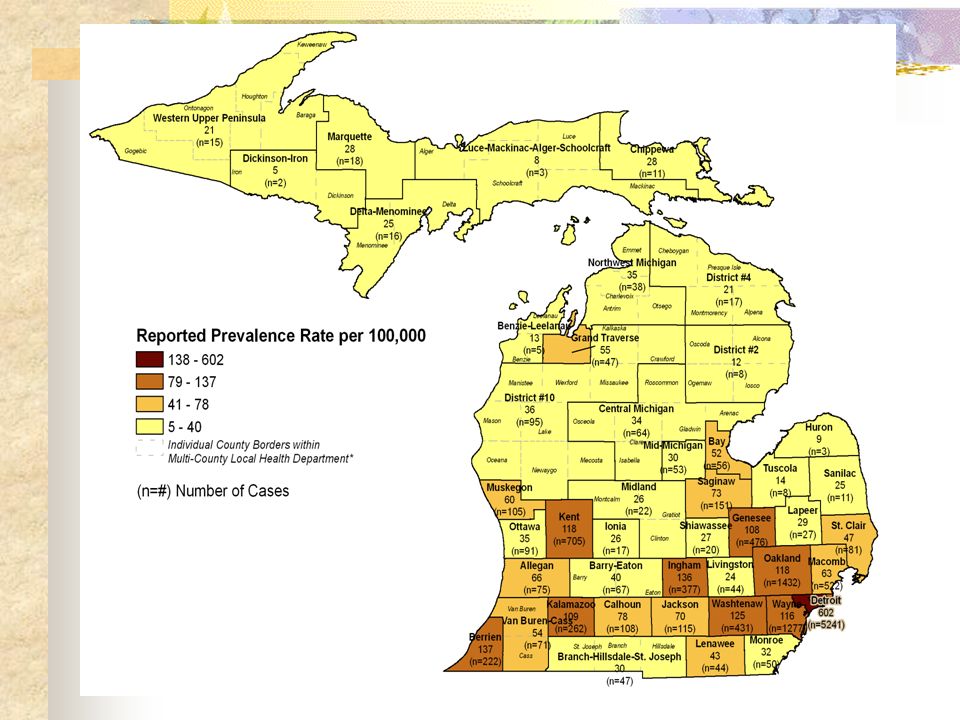
3
Prevalence Estimates of Persons Living with HIV/AIDS in MI by Sex & Race, January 1, 2008 Prevalence Estimate

4
All living persons confidentially reported with HIV infection, excluding those with AIDS. Reported Living with AIDS: Reported Living with HIV/not AIDS: All living persons confidentially reported who meet the AIDS case definition. Reported Living with HIV/AIDS: All living persons confidentially reported with HIV infection, including those with AIDS.

6
Persons living with HIV/AIDS by Sex # persons est. or reported living with HIV/AIDS

7
Persons living with HIV/AIDS by Race & Ethnicity # persons est. or reported living with HIV/AIDS

8
Persons living with HIV/AIDS by Age at Diagnosis, Ages 0-39 # persons est. or reported living with HIV/AIDS

9
Persons living with HIV/AIDS by Age at Diagnosis, Ages 40+ # persons est. or reported living with HIV/AIDS

10
Behavior Groups Behaviors facilitate transmission. It is the frequency of particular behaviors combined with the HIV prevalence in sexual or drug using networks that determines one’s risk for becoming infected. Demographic descriptors further describe those at risk.

11
Persons living with HIV/AIDS by Behavior Group # persons est. or reported living with HIV/AIDS

12
Males Reported Living with HIV/AIDS by Race & Behavior (n=10,255) # Reported Cases
 # Reported Cases")
13
Females Reported Living with HIV/AIDS by Race & Behavior (n=3,065) # Reported Cases
 # Reported Cases")
14
Persons Living with HIV/AIDS by Mode of Transmission (n=13,320)
")
15
Black Males Living with HIV/AIDS, by Mode of Transmission (n =5,551)
")
16
White Males Living with HIV/AIDS, by Mode of Transmission (n =4,139)
")
17
Black Females Living with HIV/AIDS, by Mode of Transmission (n =2,268)
")
18
White Females Living with HIV/AIDS, by Mode of Transmission (n =622)
")
19
Infection Status of Perinatal HIV Exposures 2001 - 2007

20
Number of Deaths Year of Death HIV Related Deaths in MI, all ages, by Race and Sex 1987-2006 02/05/08

21
Leading Causes of Death Among Black Men in MI Ages 25-441990-2006 Number of Deaths Year 02/05/08

22
Leading Causes of Death Among White Men in MI Ages 25-441990-2006 Number of Deaths Year 02/05/08

23
Leading Causes of Death Among Black Women in MI Ages 25-441990-2006 Number of Deaths Year 02/05/08

24
Leading Causes of Death Among White Women in MI Ages 25-441990-2006 Number of Deaths Year 02/05/08

Similar presentations
>")
 in Florida, Reported through 2012 Florida Department of Health HIV/AIDS and Hepatitis Section.>")


>")


 data as of 05/16/2012 Epidemiology of.>")
>")


