Download presentation
Presentation is loading. Please wait.

1
Blood and Airborne Pathogens HIV/AIDS/STDs/HepatitisTB/SARS/Influenza

2
Is the Greatest Political Disease in the US Issues and consequences of past and current politics have had and continue to have huge Impacts. –Has huge Social Impacts –Has huge World-Wide Impacts –Has World-Wide implications for Societies –Has World-Wide implications for the development of other diseases May become the Black Death of our Time

3
Some Topic Areas Introduction Epidemiology and Social Issues Associated with HIV What is HIV / AIDS Associated Disorders and Related Diseases –Substance Abuse –STDs, Hepatitis, TB Treatment Issues Substance Abuse Issues related to HIV Risk Behaviors Counseling Issues/Homophobia Brief Interventions

4
Prevalence - The number of people with a disorder in a population Estimate - Estimated number of people with a disorder in a population Incidence - Extent or rate of new occurrences of a disease in a population

5
Sources CDC.gov WHO.org UNAIDS.org

6
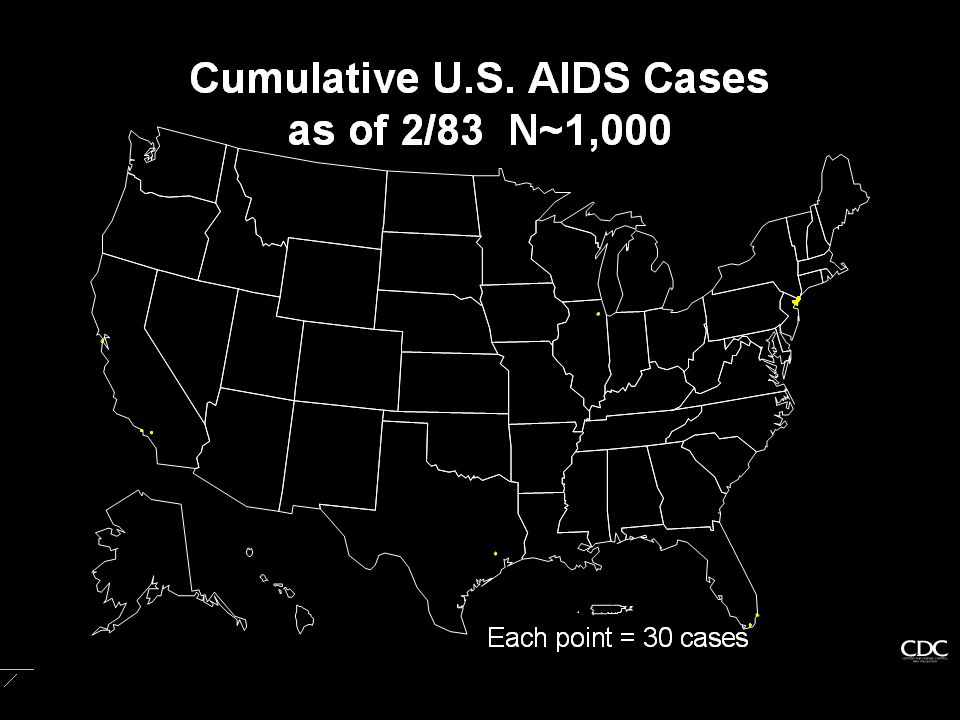
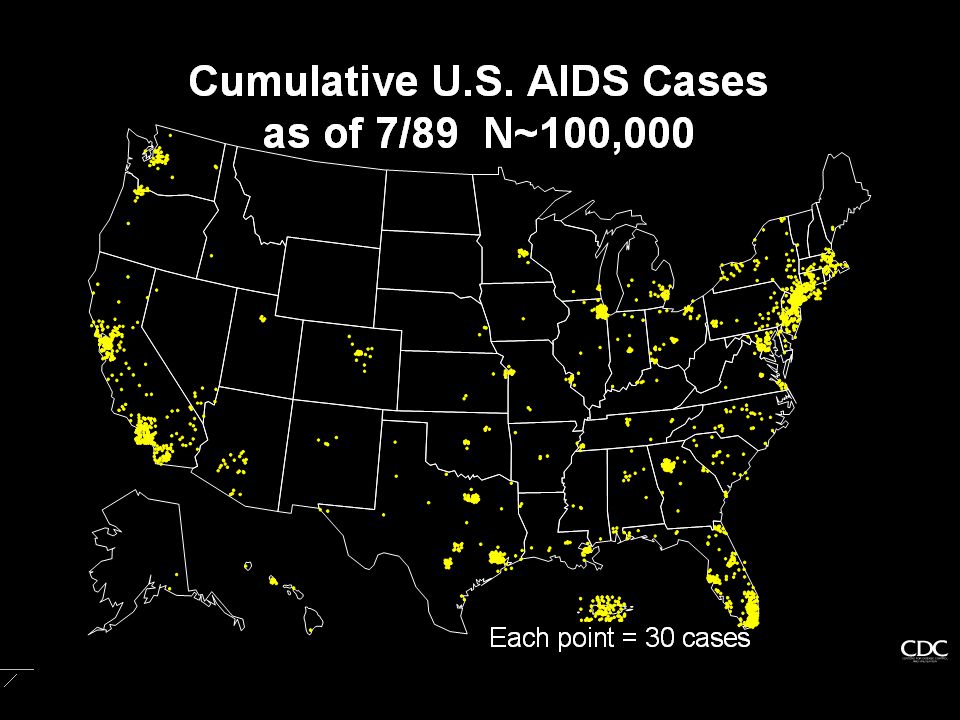
Dot Maps

12
General Trends In HIV/AIDS

17
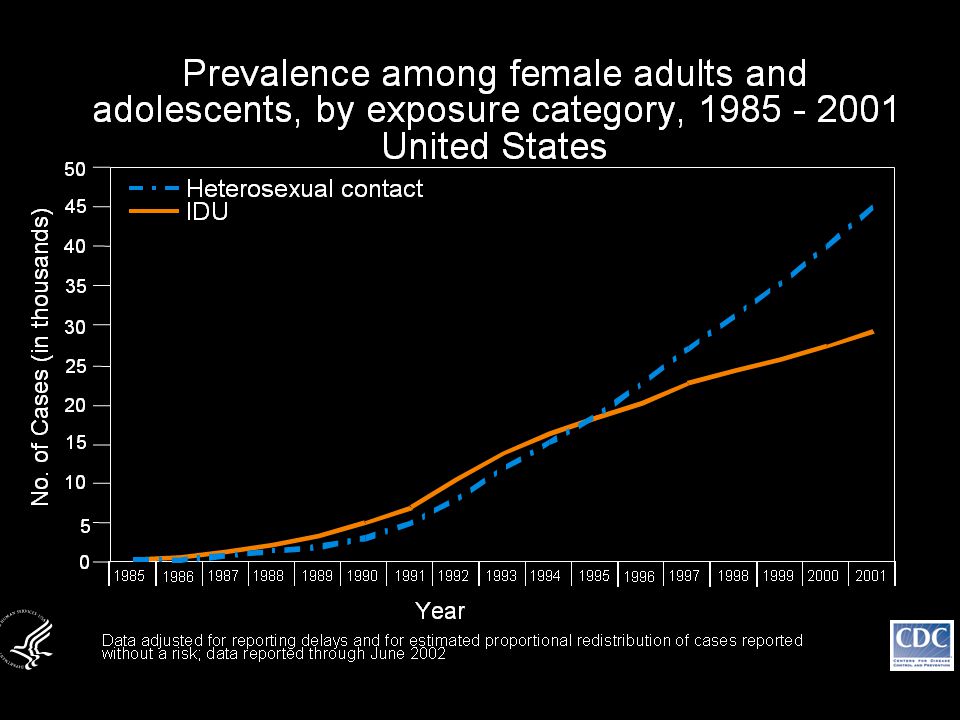
Proportion of AIDS Cases among Female Adults and Adolescents, by Exposure Category, 2002 United States Sex with injection drug user 15% Injection drug use 29% Other/not identified** 3% Sex with men of other or unspecified risk 53% † Heterosexual transmission 68% Note. Data adjusted for reporting delays and for redistribution of cases in persons initially reported without an identified risk. * Includes heterosexual contact with: a bisexual, a person with hemophilia, a transfusion recipient with HIV infection or HIV-infected person, risk not specified. ** Includes hemophilia, blood transfusion, perinatal, and risk not reported or not identified.

18
No. of Persons (in thousands) Exposure category 20-2413-1925-3435-4445+ Injection drug use 14 %%% 19243331 Heterosexual contact 61 79 74 6566 Other/not identified* 25 3 223 Age at diagnosis (in years) Proportion of AIDS Cases among Female Adults and Adolescents, by Exposure Category and Age at Diagnosis, 2002, United States Note. Data adjusted for reporting delays and for redistribution of cases in persons initially reported without an identified risk. * Includes hemophilia, blood transfusion, perinatal, and risk not reported or not identified.
 Exposure category Injection drug use 14 %%% Heterosexual contact Other/not identified* Age at diagnosis (in years) Proportion of AIDS Cases among Female Adults and Adolescents, by Exposure Category and Age at Diagnosis, 2002, United States Note. Data adjusted for reporting delays and for redistribution of cases in persons initially reported without an identified risk. * Includes hemophilia, blood transfusion, perinatal, and risk not reported or not identified..")
19
10 Northeast MidwestSouthWest Region Number of cases (in thousands) Estimated Number of AIDS Cases among Female Adults and Adolescents Attributed to Injection Drug Use and Heterosexual Contact, by Region*, Cumulative through 2002 United States 21,178 36,941 5,562 7,642 4,866 6,607 29,487 33,788 35 40 30 25 20 15 5 0 Injection drug use N=65,394 Heterosexual contact N=80,677 Note. Data adjusted for reporting delays. * Excludes persons from Puerto Rico and US dependencies, possessions and associated nations. Number of cases (in thousands

40
00002-E-40 – 1 December 2003 World HIV / AIDS Statistics

41
Global Summary of the HIV and AIDS December 2004 Global Summary of the HIV and AIDS December 2004 The ranges around the estimates in this table define the boundaries within which the actual numbers lie, based on the best available information. Number of people living with HIV in 2004Total 39.4 million (35.9 – 44.3 million) Adults 37.2 million (33.8 – 41.7 million) Women 17.6 million (16.3 – 19.5 million) Children under 15 years 2.2 million (2.0 – 2.6 million) People newly infected with HIV in 2004 Total 4.9 million (4.3 – 6.4 million) Adults 4.3 million (3.7 – 5.7 million) Children under 15 years 640 000 (570 000 – 750 000) AIDS deaths in 2004Total 3.1 million (2.8 – 3.5 million) Adults 2.6 million (2.3 – 2.9 million) Children under 15 years 510 000 (460 000 – 600 000)
 Adults 37.2 million (33.8 – 41.7 million) Women 17.6 million (16.3 – 19.5 million) Children under 15 years 2.2 million (2.0 – 2.6 million) People newly infected with HIV in 2004 Total 4.9 million (4.3 – 6.4 million) Adults 4.3 million (3.7 – 5.7 million) Children under 15 years ( – ) AIDS deaths in 2004Total 3.1 million (2.8 – 3.5 million) Adults 2.6 million (2.3 – 2.9 million) Children under 15 years ( – ).")
42
* The proportion of adults [15 to 49 years of age] living with HIV in 2004, using 2004 population numbers Regional HIV and AIDS Statistics and Features, End of 2004 3.1 million [2.8 – 3.5 million] 700 <1 700] 16 000 [8 400 – 25 000] 6 500 [ <8 500] 60 000 [39 000 – 87 000] 36 000 [24 000 – 61 000] 95 000 [73 000 – 120 000] 51 000 [25 000 – 86 000] 490 000 [300 000 – 750 000] 28 000 [12 000 – 72 000] 2.3 million [2.1 – 2.6 million] 1.1 % [1.0 - 1.3%] 0.2 [0.1 - 0.3] 0.6 [0.3 – 1.0] 0.3 [0.2 – 0.3] 0.8 [0.5 – 1.2] 2.3 [1.5 – 4.1] 0.6 [0.5 – 0.8] 0.1 [0.1 – 0.2] 0.6 [0.4 – 0.9] 0.3 [0.1 – 0.7] 7.4 [6.9 – 8.3] 4.9 million [4.3 – 6.4 million] 5 000 [2 100 – 13 000] 44 000 [16 000 – 120 000] 21 000 [14 000 – 38 000] 210 000 [110 000 – 480 000] 53 000 [27 000 – 140 000] 240 000 [170 000 – 430 000] 290 000 [84 000 – 830 000] 890 000 [480 000 – 2.0 million] 92 000 [34 000 – 350 000] 3.1 million [2.7 – 3.8 million] 39.4 million [35.9 – 44.3 million] 35 000 [25 000 – 48 000] 1.0 million [540 000 – 1.6 million] 610 000 [480 000 – 760 000] 1.4 million [920 000 – 2.1 million] 440 000 [270 000 – 780 000] 1.7 million [1.3 – 2.2 million] 1.1 million [560 000 – 1.8 million] 7.1 million [4.4 – 10.6 million] 540 000 [230 000 – 1.5 million] 25.4 million [23.4 – 28.4 million] TOTAL Oceania North America Western & Central Europe Eastern Europe & Central Asia Caribbean Latin America East Asia South and South-East Asia North Africa & Middle East Sub-Saharan Africa Adult & child deaths due to AIDS Adult prevalen ce [%] * Adults & children newly infected with HIV Adults & children living with HIV The ranges around the estimates in this table define the boundaries within which the actual numbers lie, based on the best available information.
![* The proportion of adults [15 to 49 years of age] living with HIV in 2004, using 2004 population numbers Regional HIV and AIDS Statistics and Features, End of million [2.8 – 3.5 million] 700 <1 700] [8 400 – ] [ <8 500] [ – ] [ – ] [ – ] [ – ] [ – ] [ – ] 2.3 million [2.1 – 2.6 million] 1.1 % [ %] 0.2 [ ] 0.6 [0.3 – 1.0] 0.3 [0.2 – 0.3] 0.8 [0.5 – 1.2] 2.3 [1.5 – 4.1] 0.6 [0.5 – 0.8] 0.1 [0.1 – 0.2] 0.6 [0.4 – 0.9] 0.3 [0.1 – 0.7] 7.4 [6.9 – 8.3] 4.9 million [4.3 – 6.4 million] [2 100 – ] [ – ] [ – ] [ – ] [ – ] [ – ] [ – ] [ – 2.0 million] [ – ] 3.1 million [2.7 – 3.8 million] 39.4 million [35.9 – 44.3 million] [ – ] 1.0 million [ – 1.6 million] [ – ] 1.4 million [ – 2.1 million] [ – ] 1.7 million [1.3 – 2.2 million] 1.1 million [ – 1.8 million] 7.1 million [4.4 – 10.6 million] [ – 1.5 million] 25.4 million [23.4 – 28.4 million] TOTAL Oceania North America Western & Central Europe Eastern Europe & Central Asia Caribbean Latin America East Asia South and South-East Asia North Africa & Middle East Sub-Saharan Africa Adult & child deaths due to AIDS Adult prevalen ce [%] * Adults & children newly infected with HIV Adults & children living with HIV The ranges around the estimates in this table define the boundaries within which the actual numbers lie, based on the best available information.](http://images.slideplayer.com/16/5032762/slides/slide_42.jpg "* The proportion of adults [15 to 49 years of age] living with HIV in 2004, using 2004 population numbers Regional HIV and AIDS Statistics and Features, End of million [2.8 – 3.5 million] 700 <1 700] [8 400 – ] [ <8 500] [ – ] [ – ] [ – ] [ – ] [ – ] [ – ] 2.3 million [2.1 – 2.6 million] 1.1 % [ %] 0.2 [ ] 0.6 [0.3 – 1.0] 0.3 [0.2 – 0.3] 0.8 [0.5 – 1.2] 2.3 [1.5 – 4.1] 0.6 [0.5 – 0.8] 0.1 [0.1 – 0.2] 0.6 [0.4 – 0.9] 0.3 [0.1 – 0.7] 7.4 [6.9 – 8.3] 4.9 million [4.3 – 6.4 million] [2 100 – ] [ – ] [ – ] [ – ] [ – ] [ – ] [ – ] [ – 2.0 million] [ – ] 3.1 million [2.7 – 3.8 million] 39.4 million [35.9 – 44.3 million] [ – ] 1.0 million [ – 1.6 million] [ – ] 1.4 million [ – 2.1 million] [ – ] 1.7 million [1.3 – 2.2 million] 1.1 million [ – 1.8 million] 7.1 million [4.4 – 10.6 million] [ – 1.5 million] 25.4 million [23.4 – 28.4 million] TOTAL Oceania North America Western & Central Europe Eastern Europe & Central Asia Caribbean Latin America East Asia South and South-East Asia North Africa & Middle East Sub-Saharan Africa Adult & child deaths due to AIDS Adult prevalen ce [%] * Adults & children newly infected with HIV Adults & children living with HIV The ranges around the estimates in this table define the boundaries within which the actual numbers lie, based on the best available information.")
43
Global Estimates for Adults and Children: end 2004 People living with HIV New HIV infections in 2004 Deaths due to AIDS in 2004 39.4 million [35.9 – 44.3 million] 4.9 million [4.3 – 6.4 million] 3.1 million [2.8 – 3.5 million]
![Global Estimates for Adults and Children: end 2004 People living with HIV New HIV infections in 2004 Deaths due to AIDS in million [35.9 – 44.3 million] 4.9 million [4.3 – 6.4 million] 3.1 million [2.8 – 3.5 million]](http://images.slideplayer.com/16/5032762/slides/slide_43.jpg "Global Estimates for Adults and Children: end 2004 People living with HIV New HIV infections in 2004 Deaths due to AIDS in million [35.9 – 44.3 million] 4.9 million [4.3 – 6.4 million] 3.1 million [2.8 – 3.5 million]")
44
Adults and Children Estimated to be Living with HIV: End 2004 Total: 39.4 (35.9 – 44.3) million Western & Central Europe 610 000 [480 000 – 760 000] North Africa & Middle East 540 000 [230 000 – 1.5 million] Sub-Saharan Africa 25.4 million [23.4 – 28.4 million] Eastern Europe & Central Asia 1.4 million [920 000 – 2.1 million] South & South-East Asia 7.1 million [4.4 – 10.6 million] Oceania 35 000 [25 000 – 48 000] North America 1.0 million [540 000 – 1.6 million] Caribbean 440 000 [270 000 – 780 000] Latin America 1.7 million [1.3 – 2.2 million] East Asia 1.1 million [560 000 – 1.8 million]
![Adults and Children Estimated to be Living with HIV: End 2004 Total: 39.4 (35.9 – 44.3) million Western & Central Europe [ – ] North Africa & Middle East [ – 1.5 million] Sub-Saharan Africa 25.4 million [23.4 – 28.4 million] Eastern Europe & Central Asia 1.4 million [ – 2.1 million] South & South-East Asia 7.1 million [4.4 – 10.6 million] Oceania [ – ] North America 1.0 million [ – 1.6 million] Caribbean [ – ] Latin America 1.7 million [1.3 – 2.2 million] East Asia 1.1 million [ – 1.8 million]](http://images.slideplayer.com/16/5032762/slides/slide_44.jpg "Adults and Children Estimated to be Living with HIV: End 2004 Total: 39.4 (35.9 – 44.3) million Western & Central Europe [ – ] North Africa & Middle East [ – 1.5 million] Sub-Saharan Africa 25.4 million [23.4 – 28.4 million] Eastern Europe & Central Asia 1.4 million [ – 2.1 million] South & South-East Asia 7.1 million [4.4 – 10.6 million] Oceania [ – ] North America 1.0 million [ – 1.6 million] Caribbean [ – ] Latin America 1.7 million [1.3 – 2.2 million] East Asia 1.1 million [ – 1.8 million]")
45
Estimated number of adults and children newly infected with HIV during 2004 Total: 4.9 (4.3 – 6.4) million Western & Central Europe 21 000 [14 000 – 38 000] North Africa & Middle East 92 000 [34 000 – 350 000] Sub-Saharan Africa 3.1 million [2.7 – 3.8 million] Eastern Europe & Central Asia 210 000 [110 000 – 480 000] East Asia 290 000 [84 000 – 830 000] South & South-East Asia 890 000 [480 000 – 2.0 million] Oceania 5 000 [2 100 – 13 000] North America 44 000 [16 000 – 120 000] Caribbean 53 000 [27 000 – 140 000] Latin America 240 000 [170 000 – 430 000]
![Estimated number of adults and children newly infected with HIV during 2004 Total: 4.9 (4.3 – 6.4) million Western & Central Europe [ – ] North Africa & Middle East [ – ] Sub-Saharan Africa 3.1 million [2.7 – 3.8 million] Eastern Europe & Central Asia [ – ] East Asia [ – ] South & South-East Asia [ – 2.0 million] Oceania [2 100 – ] North America [ – ] Caribbean [ – ] Latin America [ – ]](http://images.slideplayer.com/16/5032762/slides/slide_45.jpg "Estimated number of adults and children newly infected with HIV during 2004 Total: 4.9 (4.3 – 6.4) million Western & Central Europe [ – ] North Africa & Middle East [ – ] Sub-Saharan Africa 3.1 million [2.7 – 3.8 million] Eastern Europe & Central Asia [ – ] East Asia [ – ] South & South-East Asia [ – 2.0 million] Oceania [2 100 – ] North America [ – ] Caribbean [ – ] Latin America [ – ]")
46
Estimated Deaths from AIDS during 2004 Total: 3.1 (2.8 – 3.5) million Western & Central Europe 6 500 [<8 500] North Africa & Middle East 28 000 [12 000 – 72 000] Sub-Saharan Africa 2.3 million [2.1 – 2.6 million] Eastern Europe & Central Asia 60 000 [39 000 – 87 000] East Asia 51 000 [25 000 – 86 000] South & South-East Asia 490 000 [300 000 – 750 000] Oceania700 [<1 700] North America 16 000 [8 400 – 25 000] Caribbean 36 000 [24 000 – 61 000] Latin America 95 000 [73 000 – 120 000]
![Estimated Deaths from AIDS during 2004 Total: 3.1 (2.8 – 3.5) million Western & Central Europe [<8 500] North Africa & Middle East [ – ] Sub-Saharan Africa 2.3 million [2.1 – 2.6 million] Eastern Europe & Central Asia [ – ] East Asia [ – ] South & South-East Asia [ – ] Oceania700 [<1 700] North America [8 400 – ] Caribbean [ – ] Latin America [ – ]](http://images.slideplayer.com/16/5032762/slides/slide_46.jpg "Estimated Deaths from AIDS during 2004 Total: 3.1 (2.8 – 3.5) million Western & Central Europe [<8 500] North Africa & Middle East [ – ] Sub-Saharan Africa 2.3 million [2.1 – 2.6 million] Eastern Europe & Central Asia [ – ] East Asia [ – ] South & South-East Asia [ – ] Oceania700 [<1 700] North America [8 400 – ] Caribbean [ – ] Latin America [ – ]")
47
Children (<15 years) estimated to be living with HIV as of end 2004 Western & Central Europe 6 200 [4 900 – 7 900] North Africa & Middle East 24 000 [7 100 – 82 000] Sub-Saharan Africa 1.9 million [1.7 – 2.3 million] Eastern Europe & Central Asia 8 800 [7 100 – 13 000] East Asia 9 400 [3 300 – 27 000] South & South-East Asia 170 000 [95 000 – 320 000] Oceania700 [< 2 500] North America 11 000 [5 600 – 17 300] Caribbean 23 000 [12 000 – 49 000] Latin America 26 000 [21 000 – 43 000] Total: 2.2 (2.0 – 2.6) million
![Children (<15 years) estimated to be living with HIV as of end 2004 Western & Central Europe [4 900 – 7 900] North Africa & Middle East [7 100 – ] Sub-Saharan Africa 1.9 million [1.7 – 2.3 million] Eastern Europe & Central Asia [7 100 – ] East Asia [3 300 – ] South & South-East Asia [ – ] Oceania700 [< 2 500] North America [5 600 – ] Caribbean [ – ] Latin America [ – ] Total: 2.2 (2.0 – 2.6) million](http://images.slideplayer.com/16/5032762/slides/slide_47.jpg "Children (<15 years) estimated to be living with HIV as of end 2004 Western & Central Europe [4 900 – 7 900] North Africa & Middle East [7 100 – ] Sub-Saharan Africa 1.9 million [1.7 – 2.3 million] Eastern Europe & Central Asia [7 100 – ] East Asia [3 300 – ] South & South-East Asia [ – ] Oceania700 [< 2 500] North America [5 600 – ] Caribbean [ – ] Latin America [ – ] Total: 2.2 (2.0 – 2.6) million")
48
Estimated deaths in children (<15 years) from AIDS during 2004 Western & Central Europe < 100 [< 200] North Africa & Middle East 5 600 [1 700 – 19 000] Sub-Saharan Africa 450 000 [400 000 – 540 000] Eastern Europe & Central Asia 1 100 [800 – 2 200] East Asia 2 400 [900 – 6 900] South & South-East Asia 37 000 [22 000 – 70 000] Oceania < 200 [< 600] North America < 100 [< 200] Caribbean 5 300 [2 700 – 11 000] Latin America 6 000 [4 800 –9 800] Total: 510 000 (460 000 – 600 000)
![Estimated deaths in children (<15 years) from AIDS during 2004 Western & Central Europe < 100 [< 200] North Africa & Middle East [1 700 – ] Sub-Saharan Africa [ – ] Eastern Europe & Central Asia [800 – 2 200] East Asia [900 – 6 900] South & South-East Asia [ – ] Oceania < 200 [< 600] North America < 100 [< 200] Caribbean [2 700 – ] Latin America [4 800 –9 800] Total: ( – )](http://images.slideplayer.com/16/5032762/slides/slide_48.jpg "Estimated deaths in children (<15 years) from AIDS during 2004 Western & Central Europe < 100 [< 200] North Africa & Middle East [1 700 – ] Sub-Saharan Africa [ – ] Eastern Europe & Central Asia [800 – 2 200] East Asia [900 – 6 900] South & South-East Asia [ – ] Oceania < 200 [< 600] North America < 100 [< 200] Caribbean [2 700 – ] Latin America [4 800 –9 800] Total: ( – )")
49
Estimated number of children (<15 years) newly infected with HIV during 2004 Western & Central Europe < 100 [< 200] North Africa & Middle East 9 100 [2 800 – 30 000] Sub-Saharan Africa 560 000 [500 000 – 650 000] Eastern Europe & Central Asia 1 800 [1 200 – 3 700] East Asia 4 100 [1 500 – 11 000] South & South-East Asia 51 000 [30 000 – 95 000] Oceania < 300 [< 1 000] North America < 100 [< 200] Caribbean 6 100 [3 100 – 13 000] Latin America 6 800 [5 400 – 11 000] Total: 640 000 (570 000 – 750 000)
![Estimated number of children (<15 years) newly infected with HIV during 2004 Western & Central Europe < 100 [< 200] North Africa & Middle East [2 800 – ] Sub-Saharan Africa [ – ] Eastern Europe & Central Asia [1 200 – 3 700] East Asia [1 500 – ] South & South-East Asia [ – ] Oceania < 300 [< 1 000] North America < 100 [< 200] Caribbean [3 100 – ] Latin America [5 400 – ] Total: ( – )](http://images.slideplayer.com/16/5032762/slides/slide_49.jpg "Estimated number of children (<15 years) newly infected with HIV during 2004 Western & Central Europe < 100 [< 200] North Africa & Middle East [2 800 – ] Sub-Saharan Africa [ – ] Eastern Europe & Central Asia [1 200 – 3 700] East Asia [1 500 – ] South & South-East Asia [ – ] Oceania < 300 [< 1 000] North America < 100 [< 200] Caribbean [3 100 – ] Latin America [5 400 – ] Total: ( – )")
50
About 14 000 new HIV infections a day in 2004 More than 95% are in low and middle income countries Almost 2000 are in children under 15 years of age About 12 000 are in persons aged 15 to 49 years, of whom: — almost 50% are women — about 50% are 15–24 year olds

51
Children living with HIV New HIV infections in 2004 Deaths due to AIDS in 2004 End-2004 global HIV and AIDS estimates Children (<15 years) 2.2 million [2.0 – 2.6 million] 640 000 [570 000 – 750 000] 510 000 [460 000 – 600 000]
![Children living with HIV New HIV infections in 2004 Deaths due to AIDS in 2004 End-2004 global HIV and AIDS estimates Children (<15 years) 2.2 million [2.0 – 2.6 million] [ – ] [ – ]](http://images.slideplayer.com/16/5032762/slides/slide_51.jpg "Children living with HIV New HIV infections in 2004 Deaths due to AIDS in 2004 End-2004 global HIV and AIDS estimates Children (<15 years) 2.2 million [2.0 – 2.6 million] [ – ] [ – ]")
52
Other STDs

53
Chlamydia — Rates: United States, 1984–2003

54
Chlamydia — Rates by Sex: United States, 1984–2003 Chlamydia — Rates by Sex: United States, 1984–2003

55
Chlamydia — Rates by Region: United States, 1984–2003

56
Chlamydia — Rates by State: United States and outlying areas, Note: The total rate of chlamydia for the United States and outlying areas (Guam, Puerto Rico and Virgin Islands) was 301.3 per 100,000 population. 2003

57
Chlamydia — Rates by County: United States, 2003

58
Gonorrhea — Rates: United States, 1970–2003 Note: The Healthy People 2010 target for gonorrhea is 19.0 cases per 100,000 population.

59
Gonorrhea — Rates by State: 2003 Note: The total rate of gonorrhea for the United States and outlying areas (Guam, Puerto Rico and Virgin Islands) was 114.7 per 100,000 population. The Healthy People 2010 target is 19.0 cases per 100,000 population.

60
Gonorrhea — Rates by Region: United States, 1981–2003 Note: The Healthy People 2010 target for gonorrhea is 19.0 cases per 100,000 population.

61
Gonorrhea — Rates by Sex: United States, 1981–2003 Note: The Healthy People 2010 target for gonorrhea is 19.0 cases per 100,000 population.

62
Gonorrhea — Rates by Race and Ethnicity: United States, 1981–2003 Note: The Healthy People 2010 target for gonorrhea is 19.0 cases per 100,000 population.

63
Gonococcal Isolate Surveillance Project (GISP) — Percent of gonorrhea cases that occurred among MSM, 1988 – 2003
 — Percent of gonorrhea cases that occurred among MSM, 1988 – 2003")
64
Syphilis — Cases by Stage of Infection: United States, 1941–2003

65
Primary and Secondary Syphilis : United States, 1970–2003 Note: The Healthy People 2010 target for P&S syphilis is 0.2 case per 100,000 population.

66
Primary and Secondary Syphilis Rates by State: 2003 Note: The total rate of primary and secondary syphilis for the United States and outlying areas (Guam, Puerto Rico and Virgin Islands) was 2.5 per 100,000 population. The Healthy People 2010 target is 0.2 case per 100,000 population.

67
Primary and Secondary Syphilis Rates by County: 2003 Note: The Healthy People 2010 target for P&S syphilis is 0.2 case per 100,000 population.

68
Primary and Secondary Syphilis Rates by Region: 1981–2003 Note: The Healthy People 2010 target for P&S syphilis is 0.2 case per 100,000 population.

69
Primary and Secondary Syphilis Rates by Race and Ethnicity: 1981–2003 Note: The Healthy People 2010 target for P&S syphilis is 0.2 case per 100,000 population.

70
Primary and Secondary Syphilis Rates by Sex: 1981–2003 Note: The Healthy People 2010 target for P&S syphilis is 0.2 case per 100,000 population.

71
Primary and Secondary Syphilis Age-specific rates among women 10 to 44 years of age: 1981–2003

72
Primary and Secondary Syphilis Age-specific rates among men 10 to 44 years of age: 1981–2003

73
Primary and Secondary Syphilis Male-to-Female Ratios: 1981–2003

74
Chancroid 1981 – 2003

75
Genital Herpes 1966 – 2003 SOURCE: National Disease and Therapeutic Index (IMS Health)
")
76
Genital Warts 1966 – 2003 SOURCE: National Disease and Therapeutic Index (IMS Health)
")
77
Trichomoniasis and Other Vaginal Infections 1966–2003 SOURCE: National Disease and Therapeutic Index (IMS Health)
")
78
Chancroid — Reported cases: United States, 1981–2002

79
Gonococcal Isolate Surveillance Project (GISP) — Percent of gonorrhea cases that occurred among MSM, 1988-2002
 — Percent of gonorrhea cases that occurred among MSM,")
80
Idaho Statistics

Similar presentations


 data as of 05/16/2012 Epidemiology of.>")


![1 July 2008 e Global summary of the AIDS epidemic, December 2007 Total33 million [30 – 36 million] Adults30.8 million [28.2 – 34.0 million] Women15.5 million.](/23/6641248/big_thumb.jpg "1 July 2008 e Global summary of the AIDS epidemic, December 2007 Total33 million [30 – 36 million] Adults30.8 million [28.2 – 34.0 million] Women15.5 million.>")

