Download presentation
Presentation is loading. Please wait.

1
South Carolina Economic Update Dr. Don Schunk Research Economist BB&T Center for Economic & Community Development Coastal Carolina University October 5, 2009

2
SC Total Employment Jan. 1990 – August 2009 June 2000: 1,883,300 jobs August 2009: 1,848,600 jobs

3
US Total Employment Jan. 1990 – September 2009 Feb. 2001: 132.5 million jobs Sept. 2009: 130.9 million jobs

4
Myrtle Beach MSA Total Employment Jan. 1990 – August 2009

5
Columbia MSA Total Employment Jan. 1990 – August 2009

6
Greenville MSA Total Employment Jan. 1990 – August 2009

7
Spartanburg MSA Total Employment Jan. 1990 – August 2009

8
SC Total Employment: Annual Job Growth Jan 1940 – August 2009 August 2009: -4.1%

9
Recent Unemployment Trends in South Carolina

10
SC Unemployment Rate Jan. 1976 – August 2009

11
SC Unemployed & UI Claims Jan. 1987 – August 2009

12
SC Employment Jan. 2009 – August 2009

13
UI Exhaustion Rate June 1972 – August 2009 People are exhausting UI benefits at a record rate… this is why continued claims, unemployed, and unemployment rate have been falling.

14
SC Labor Force Jan. 2009 – August 2009 SC’s labor force fell by 28,000 between May and August 2009

15
SC Unemployment Rate revisited Jan. 2009 – August 2009 12.6% 11.5% Given the actual trends in employment, what if the state’s labor force had remained unchanged since May?

16
SC Initial Claims for UI Jan. 2009 – August 2009

17
SC Initial Claims & Unemployment Jan. 2009 – August 2009

18
U.S. Real GDP Growth 1990Q1 – 2010Q4 20003.7% 20010.8% 20021.6% 20032.5% 20043.6% 20052.9% 20062.8% 20072.0% 20081.1% 2009-2.6% 20101.5%

19
Headwinds Affecting Consumer Spending

20
Job losses, flat incomes, household rebalancing translates into weak consumer spending Aug. 2008 to Aug. 2009: US Retail Sales down 5.6%

21
S.C. Retail Sales Jan. 1990 – July 2009 May-July 2008 to May-July 2009: SC Retail Sales down 12.5%

22
A Few Key Sectors in South Carolina June 2008 – June 2009: SC net loss of 92,700 jobs –Manufacturing: -29,800 –Leisure & Hospitality: -16,500 –Retail Trade: -12,100 –Construction: -10,900 (-24,400 since June 2007) These sectors ~ 40% of all jobs These + Govt. ~ 60% of all jobs From 2002-2007: SC Employment increased by roughly 155 thousand –Over 50% of the job growth came from construction, leisure & hospitality, retail trade, and local government

23
SC Total Employment: Annual Job Growth 1940Q1 – 2010Q4 20001.6% 2001-1.9% 2002-1.0% 20030.2% 20041.4% 20051.8% 20062.2% 20072.0% 2008-0.9% 2009-4.3% 2010-1.7%

24
S.C. Total Employment Growth: Annual 1990 - 2010 20001.6% 2001-1.9% 2002-1.0% 20030.2% 20041.4% 20051.8% 20062.2% 20072.0% 2008-0.9% 2009-4.3% 2010-1.7%

25
S.C. Unemployment Rate 1976Q1 – 2010Q4 SC’s unemployment rate: Expected to approach 15%, perhaps during Spring 2010 The roles of: -ongoing job losses -sluggish job growth -labor force growth What about broader measures of unemployment?

26
SC Manufacturing Employment 1970Q1 – 2010Q4 140,000 net job loss from 2000 - 2010

27
The State of Economic Development in South Carolina

28
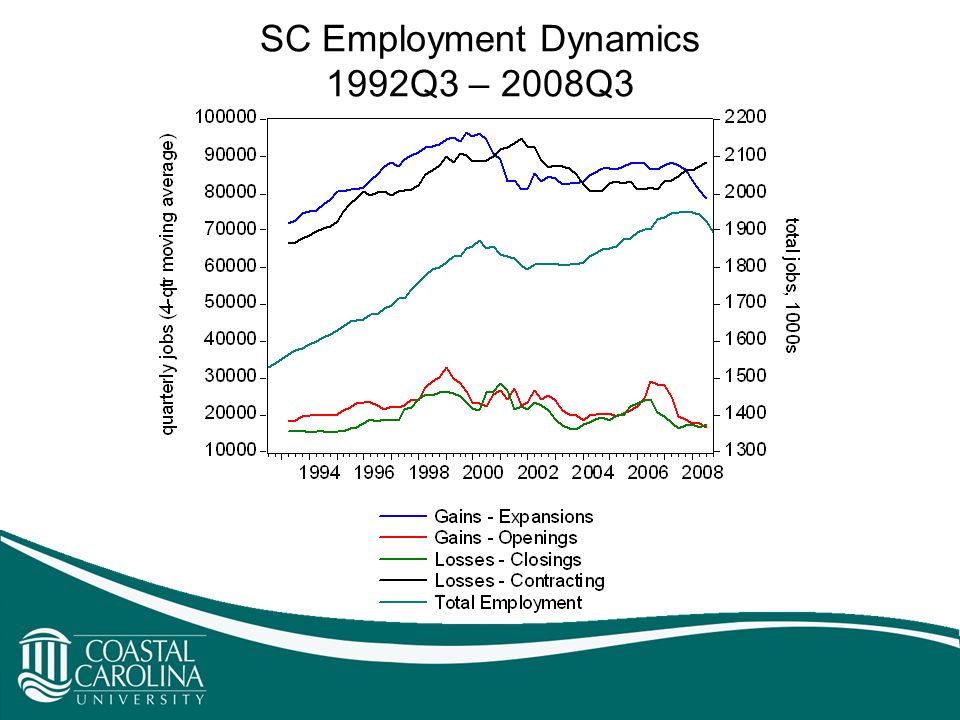
SC Employment Dynamics 1992Q3 – 2008Q3

30
How do we add jobs? -Attract New Business -Encourage Expansion -Prevent Closings -Prevent Contractions

Similar presentations