Download presentation
Presentation is loading. Please wait.

1
Santee-Lynches Economic Forecast 2009-2010 Presented by: Santee-Lynches Regional COG & The BB&T Center for Economic and Community Development at Coastal Carolina University

2
SC Total Employment Jan 1990 – March 2009 June 2000: 1,883,300 jobs March 2009: 1,853,300 jobs

3
SC Total Employment: Annual Job Growth Jan 1939 – March 2009 March 2009: -4.9%

4
Unemployment Rates Jan. 1976 – March 2009

5
S.C. Unemployment Indicators Jan. 1987 – March 2009

6
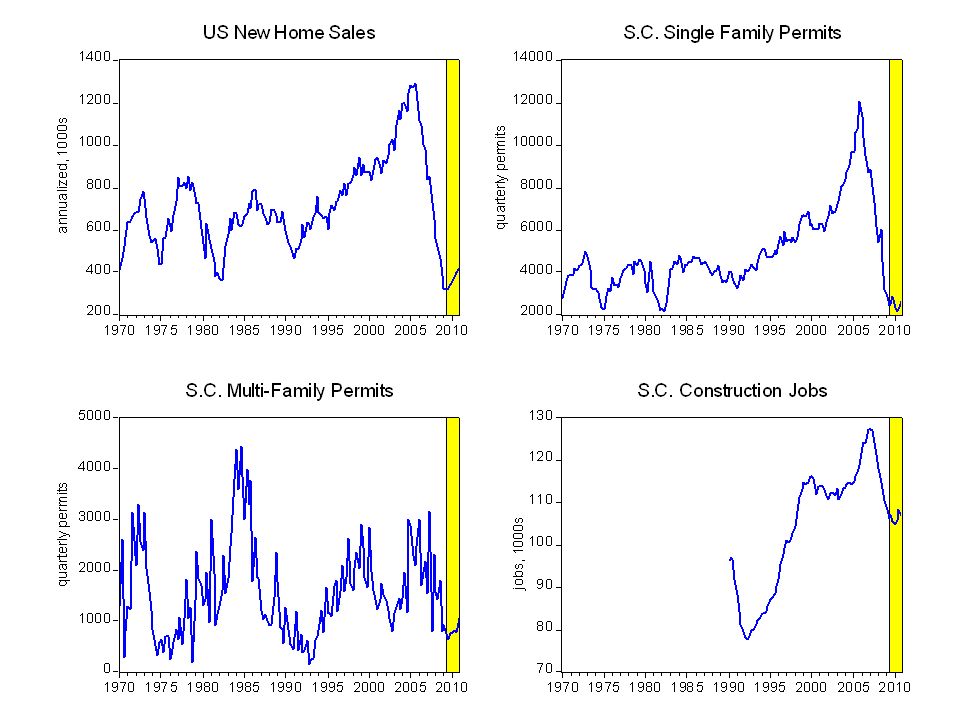
A Few Key Sectors in South Carolina 2008Q1 – 2009Q1: SC lost 83 thousand jobs –Manufacturing: -22,000 –Leisure & Hospitality: -14,000 –Retail Trade: -14,000 –Construction: -10,000 (-19,000 since 2007Q1) These sectors ~ 40% of all jobs These + Govt. ~ 60% of all jobs

10
S.C. Labor Market Indicators 1976Q1 – 2010Q4

11
Gross Retail Sales ($ billions)
")
12
Total Employment (thousands)
")
13
Labor Force (thousands)
")
14
Unemployment Rate (percent)
")
15
Historical Unemployment Rates 1994 - 2008

16
-7,606 manufacturing job losses from 2000-3rdQ ‘08 for region. Source: Quarterly Census of Employment and Wages (QCEW)
.")
17
+2,010 non-manufacturing job gains from 2000-3rdQ ’08 for region. Source: Quarterly Census of Employment and Wages (QCEW)
.")
18
Whole body of 8 th graders through the years 65% - 70% are graduating high school with a diploma over time in region. High School Years Public high school graduation rates in region Current region average of 65% to 70% is about equal to state average. U.S. average is about 72% in recent years. Source: S.C. Department of Education enrollment and diploma data

19
Source: U.S. Census Bureau

21
Single Family Building Permits (# of permits)
")
22
Single Family Permits Value ($millions)
")
23
Manufactured/Mobile Home Permits (# of permits)
")
24
Nonresidential Building Permits (# of permits)
")
25
Nonresidential Permit Value ($millions)
")
26
GDP Growth Rate (percent)
")
27
CPI Inflation Rate (percent)
")
28
Prime Rate (percent)
")
29
30-Year Conventional Mortgage Rate (percent)
")
30
3-Month Treasury Rate (percent)
")
31
10-Year Treasury Rate (percent)
")
32
South Carolina Total Employment (millions)
")
33
South Carolina Unemployment Rate (percent)
")
Similar presentations