Download presentation
Presentation is loading. Please wait.

1
Secondary Analysis Research on Ethnicity Using Government Data & SARs Reza Afkhami ESDS Government & SARs 1 st November University of Bristol

2
Outline Issues and Problems in Secondary Analysis of Ethnic Minority Data Some Research Exemplars Comparability of 1991/2001 SARs ethnicity Classifications ESDS Resources for ethnicity

3
Issues in Secondary Analysis of Ethnic Minority Data (1) Sample size Boosted samples and weighting Aggregation of surveys Country of birth Geography
 Sample size Boosted samples and weighting Aggregation of surveys Country of birth Geography")
4
Issues in Secondary Analysis of Ethnic Minority Data (2) Change of question wording Consistency over time Mixed and other Categories Age
 Change of question wording Consistency over time Mixed and other Categories Age")
5
Age profile of ethnic groups Source: Vivienne Avery

6
Research Exemplars Labour Market Pension Identity Health Women Income Household formation

7
Research Exemplars: Labour Market Questions How is the role of human capital (education) in the labour market attainment for ethnic minorities? How is the ethnic minority disadvantage in the labour market?

8
Unemployment rates in UK by ethnic group and sex, ALALFS 2001/02 Source: Vivienne Avery

9
Research Exemplars: Pension Questions: How do private pension prospects vary among ethnic groups? Is womens disadvantage the same in each ethnic group? What explains minority ethnic disadvantage in pensions?

10
Percentage contributing to a private pension by ethnic group. Men and women 20-59 Source: Jay Ginn Family Resource Survey 1994-96

11
Research Exemplars: Economic Activity for Women Source: Dale, et al

12
Economic activity and employment women aged 19-60 Spring QLFS, 2000-2, excl. full-time students Source: Angela Dale and Jo Lindley

13
Economic activity by degree level qualifications women 19-60, excl.FT students, 2000-2

14
Key points about ethnic minority women –Unemployment particularly high amongst minority ethnic women –Part-time working highest for white women –Black Caribbean women have highest levels of economic activity and highest levels of full-time working –Pakistani and Bangladeshi women have lowest levels of economic activity

15
Research Exemplars: National Identity Meaning of British in LFS questionnaire –Pertaining to UK state –Pertaining to mainland British state (excl Ireland) –Pertaining to territorial area of Britain –Pertaining to nation inclusive of others –Pertaining to nation exclusive of others –White –Pertaining to cultural or other background qualifying group defined by skin colour
 –Pertaining to territorial area of Britain –Pertaining to nation inclusive of others –Pertaining to nation exclusive of others –White –Pertaining to cultural or other background qualifying group defined by skin colour")
17
Research Exemplars: Health To compare the percentage of obese or overweight children within different ethnic and socio-economic groups

18
Interrelationships Diabetes Cardiovascular disease Black Caribbean S. Asian ethnicity Obesity

19
Risk of obesity in boys by ethnic group Source: Saxena, et al.

20
Risk of obesity in girls by ethnic group Source: Saxena, et al.

21
Reported fair or bad health by ethnic group and age Source: James Nazroo Health Survey for England 1999

22
Ethnic differences in equivalised household income Source: James Nazroo Health Survey for England 1999 Health Survey for England 1999

23
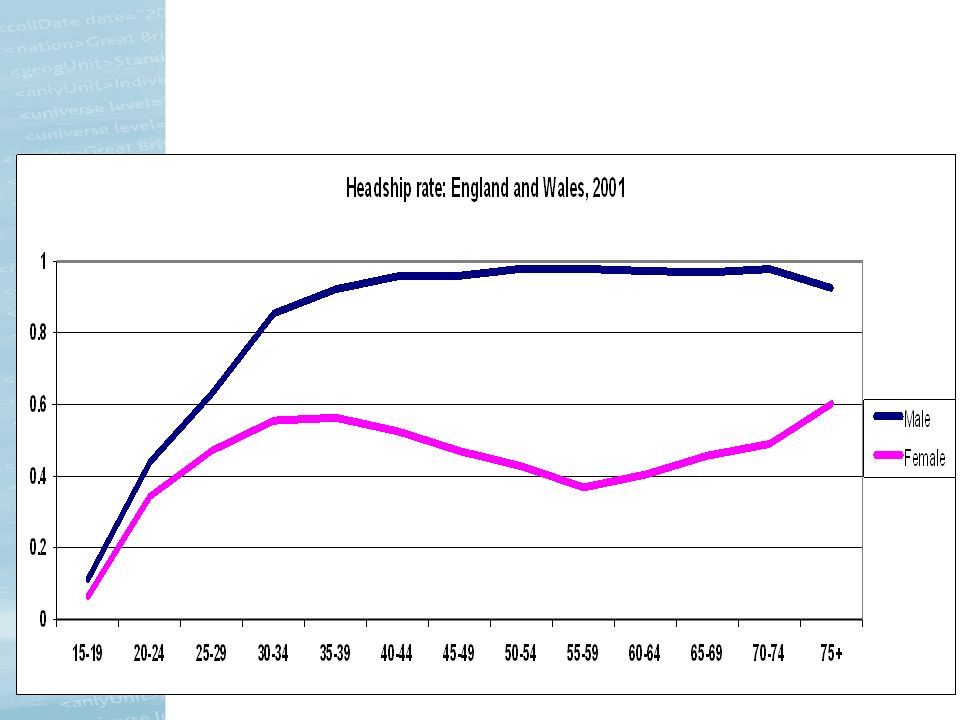
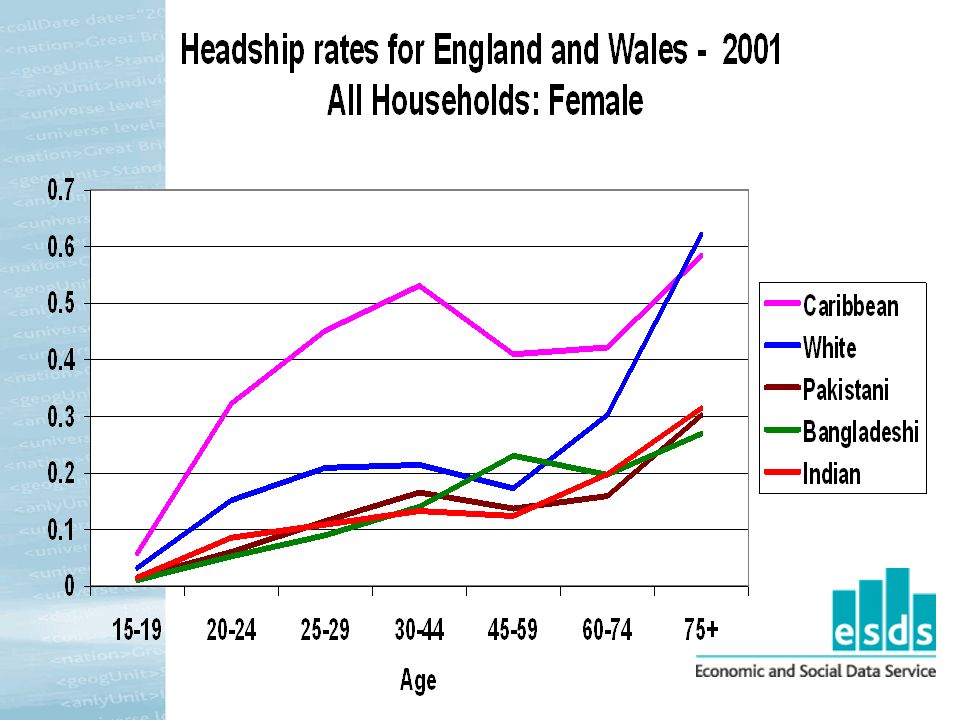
How household formation varies between ethnic groups and LADs ? Tajar & Simpson (2005) Data: CAMS (The Controlled Access Microdata Sample). This is a 3% individual sample from the UK 2001 census data.Controlled Access Microdata Sample One of the most common ways of summarising household patterns is by the use of headship rates – the proportion of those in a particular age, sex or other group who are designated as head of household.
 Data: CAMS (The Controlled Access Microdata Sample). This is a 3% individual sample from the UK 2001 census data.Controlled Access Microdata Sample One of the most common ways of summarising household patterns is by the use of headship rates – the proportion of those in a particular age, sex or other group who are designated as head of household..")
27
Geographical effect

28
Conclusion oHigher headship rate of Caribbean women in their thirties and forties compared to other ethnic groups for England and Wales and also for LADs: high number of lone parent Caribbean women. oThere are geographical variations within ethnic groups.

29
Ethnic group Comparison in 1991/2001 Census Ethnic group questions in 1991 and 2001 Changes to ethnic identification Recommendations for comparing 1991 and 2001 Census ethnic groups

30
Ethnic group questions in 1991 and 2001 Ethnicity question asked in 1991 census for England, Wales and Scotland All UK countries included ethnic question in 2001 census but questions in Scotland and Northern Ireland each differed from E&W

31
The 1991 Census ethnic group question asked in England, Wales and Scotland

32
The 2001 Census ethnic group question asked in England and Wales

33
Changes to ethnic identification The most stable categories; White, Indian, Pakistani, Bangladeshi and Chinese. Less stable categories; the Black African and Black Caribbean groups The least stable; the Other ethnic groups

34
Recommendations for comparing 1991 and 2001 Census ethnic groups a ten-category classification; an eight category classification; a five-category classification; and a two-category classification. More groups combined; greater stability at the cost of losing the detail Balance between reliability and ethnic group detail depends on the specific analysis

35
Ten category classification

36
Eight category classification

37
Five category classification

38
Two category classification

39
ESDS Resources on Ethnicity –LFS-Ethnicity Consistent over time –GHS-Ethnicity Consistent over time –Ethnicity Theme Page

Similar presentations


>")


 Conference on Community, Migration and Ethnicity.>")

>")


