Download presentation
Presentation is loading. Please wait.

1
Thrusts of Noah LSM Development and Land Data Assimilation at NCEP: recent ops upgrades, testbeds, validation, recent lessons, physics changes, calibration, new vegetation, albedo & snow cover data sets Ken Mitchell EMC Land Team and Collaborators WRF Land Modeling Working Group Meetings 13-15 September 2005

2
Outline Noah LSM upgrades in ops Eta/NAM meso model of May 05 –Hi-res USGS vegetation types & STATSGO soil types –Recalibrated canopy resistance parameters Noah LSM uncoupled testbeds at NCEP –N. American & Global Land Data Assimilation Systems) –Porting the NASA Land Information System (LIS) –Revisiting the optimum LAI value for the Noah LSM JCSDA: Joint Center for Satellite Data Assimilation –Joint NCEP-NASA-NESDIS-AFWA-NAVY –New vegetation, snow cover and albedo databases Anticipated future upgrades to the Noah LSM
 –Porting the NASA Land Information System (LIS) –Revisiting the optimum LAI value for the Noah LSM JCSDA: Joint Center for Satellite Data Assimilation –Joint NCEP-NASA-NESDIS-AFWA-NAVY –New vegetation, snow cover and albedo databases Anticipated future upgrades to the Noah LSM.")
3
Noah LSM upgrades in NCEP operational Eta/NAM mesoscale model of May 03 Implement Noah LSM Version 2.7.1 –Upgrade from Version 2.3.2 –Includes new patchy snow cover treatment for sfc fluxes & skin T –Substantially eliminate early snowpack depletion bias –Surface emissivity less than unity over snowpack (0.95) Reduce Noah LAI value from 5 (Version 2.7.1) to 2 –Use of high LAI=5 in Noah 2.7.1 emerged from glitch in NLDAS Apply 1-km USGS global landuse database –replaces 1-deg NASA/ISLSCP BiB global landuse Apply 1-km STATSGO landuse database –Replaces 1-deg NASA/ISLSCP 1-deg Zober Tune canopy resistance and soil parameter tables
 Reduce Noah LAI value from 5 (Version 2.7.1) to 2 –Use of high LAI=5 in Noah emerged from glitch in NLDAS Apply 1-km USGS global landuse database –replaces 1-deg NASA/ISLSCP BiB global landuse Apply 1-km STATSGO landuse database –Replaces 1-deg NASA/ISLSCP 1-deg Zober Tune canopy resistance and soil parameter tables")
4
USGS landuse on 12-km EgridSiB landuse on 1-deg base grid STATSGO soil texture on 12-km Egrid Zobler soil texture on 1-deg base grid

5
EROS Data Center also offers this global 1-km SiB landuse database Aside: Boston U. group has just delivered MODIS-based global 1-km SiB landuse map (not shown) Suggested Discussion Point for Thursday session: Easier tuning of canopy resistance parameters when fewer landuse classes.
 Suggested Discussion Point for Thursday session: Easier tuning of canopy resistance parameters when fewer landuse classes..")
6
Ops Eta Model Soil Moisture Precipitation Analysis

8
Jul 04 Jul 05 T T RH MDW

9
NESDIS has new 12-year Global 0.144-deg monthly Green vegetation fraction (GVF) Climatology to replace former 5-year climatology (same grid). NEW: JULY OLD: JULY The new GVF product is also available as a realtime weekly update (Mondays) – not shown Both climo and weekly update based on AVHRR NDVI
 – not shown Both climo and weekly update based on AVHRR NDVI.")
10
Difference of new-minus-old NESDIS July greenness fraction climatology New field has higher greenness fraction over central US

11
NESDIS IMS snow maps over North America. Apr 29, 2005 4 km resolution (new)24 km resolution (old) NESDIS has upgraded its operational daily Interactive Multi-sensor Snow (IMS) analysis from 24-km resolution to 4-km resolution. The new 4-km analysis will be implemented In the NCEP WFRF-NMM model.
24 km resolution (old) NESDIS has upgraded its operational daily Interactive Multi-sensor Snow (IMS) analysis from 24-km resolution to 4-km resolution. The new 4-km analysis will be implemented In the NCEP WFRF-NMM model..")
12
From U.Arizona / X. Zeng New MODIS-based 5-km global database of maximum albedo for Deep snow conditions. From Robinson and Kukla Older 1-degree global database of maximum Albedo for deep snow conditions.

13
Difference of Zeng minus Robinson max snow albedo over N. America (on 12-km ops NAM Eta model grid)
")
14
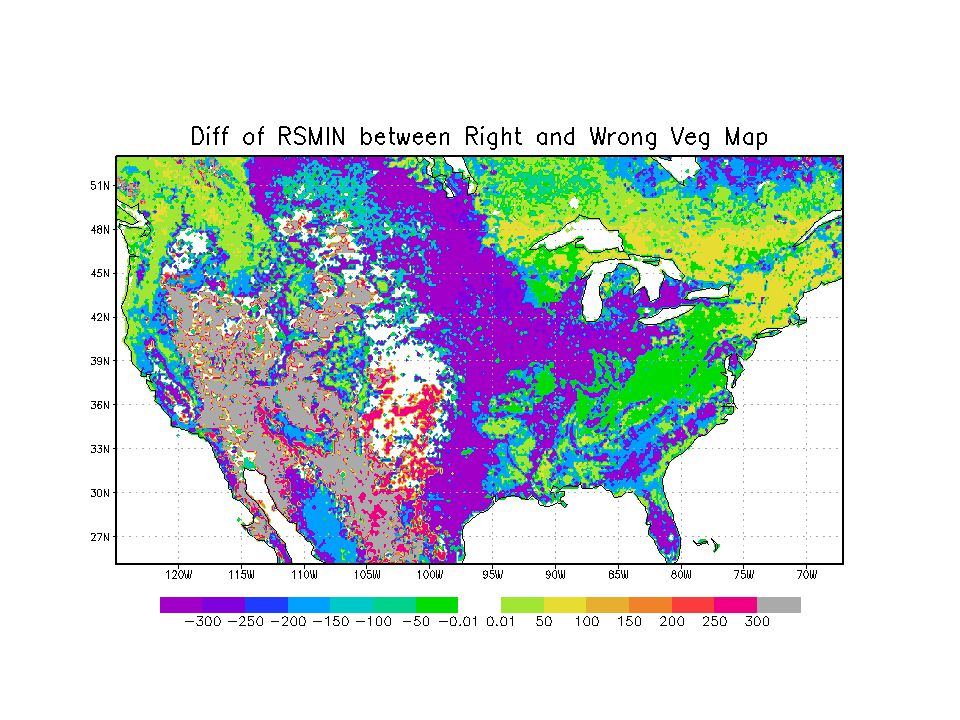
NLDAS: The N. American Land Data Assimilation System Recent lessons learned about: 1)the optimum LAI value for the Noah LSM 1)impact on transpiration in Oklahoma region owing to change from 1-deg 12-class SiB to 1-km 27-class USGS landuse
the optimum LAI value for the Noah LSM 1)impact on transpiration in Oklahoma region owing to change from 1-deg 12-class SiB to 1-km 27-class USGS landuse.")
15
NLDAS Design (The Uncoupled Approach) 1. Force models with 4DDA surface meteorology (Eta/EDAS), except use actual observed precipitation (gage-only daily precip analysis disaggregated to hourly by radar product) and hourly downward solar insolation (derived from GOES satellites). 2. Use 4 different land surface models: – NOAH (NOAA/NWS/NCEP) – MOSAIC (NASA/GSFC) – VIC (Princeton U./ U. Washington) – Sacramento (NOAA/OHD) 3. Evaluate results with all available observations, including soil moisture, soil temperature, surface fluxes, satellite skin temperature, snow cover and runoff. Project Leader: Dag Lohmann
, except use actual observed precipitation (gage-only daily precip analysis disaggregated to hourly by radar product) and hourly downward solar insolation (derived from GOES satellites). 2. Use 4 different land surface models: – NOAH (NOAA/NWS/NCEP) – MOSAIC (NASA/GSFC) – VIC (Princeton U./ U. Washington) – Sacramento (NOAA/OHD) 3. Evaluate results with all available observations, including soil moisture, soil temperature, surface fluxes, satellite skin temperature, snow cover and runoff. Project Leader: Dag Lohmann.")
16
NLDAS Lesson 1 Wide disparity among land models in warm season evaporation over non-sparse green vegetation

17
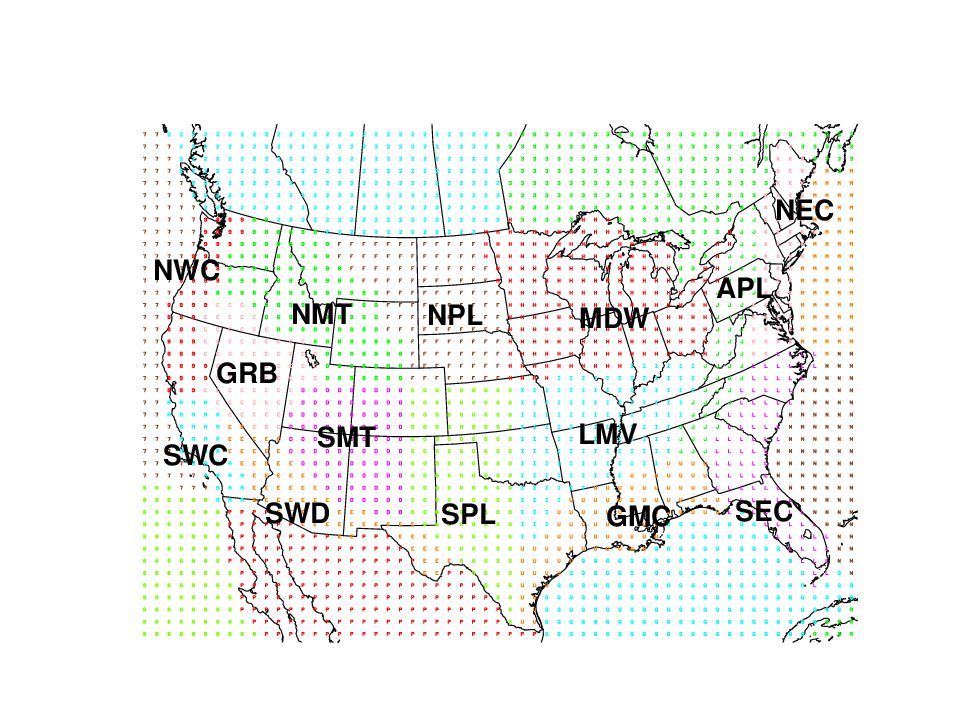
Top row: Map of NLDAS predominant class of vegetation type (A) and soil type (B) Bottom row: Climo Jul green veg (C) from Gutman et al and avg annual precip total in mm (D)
 and soil type (B) Bottom row: Climo Jul green veg (C) from Gutman et al and avg annual precip total in mm (D)")
18
NLDAS Model Mean Annual Evaporation (mm) over Oct 97 – Sep 99
 over Oct 97 – Sep 99")
19
Seasonal change of total column soil moisture: 30Apr minus 30Sep, 99, at 23Z: For the four NLDAS land models

20
Monthly Surface Water Budget dS = P – R – E Annual Surface Water Budget P = E + R * * * *

21
July 1999 April 1999 Fig. 22 SGP ARM/CART Monthly Mean Diurnal Cycle of Surface Energy Fluxes

22
Mean Diurnal Cycle of Sensible Heat Fluxes From OU Mesonet/OASIS: summer 2000 (Basar/Nemunaitis

23
Why differences in warm season evaporation over non-sparse vegetation? Canopy resistance specification Canopy interception of rainfall Rooting depths Green vegetation cover and LAI Upward diffusion of soil water from below root zone Interaction of infiltration and evaporation over the annual cycle

24
Evapotranspiration Treatment WHERE: E = total evapotranspiration from combined soil/vegetation E dir = direct evaporation from soil E t = transpiration through plant canopy E c = evaporation from canopy-intercepted rainfall

25
Canopy Resistance Issues _ Canopy transpiration determined by: – Amount of photosynthetically active (green) vegetation. Green vegetation fraction ( f ) partitions direct (bare soil) evaporation from canopy transpiration: E t /E dir ≈ f( f ) – Green vegetation in Eta based on 5 year NDVI climatology of monthly values – Not only the amount, but the TYPE of vegetation determines canopy resistance (R c ):
 partitions direct (bare soil) evaporation from canopy transpiration: E t /E dir ≈ f( f ) – Green vegetation in Eta based on 5 year NDVI climatology of monthly values – Not only the amount, but the TYPE of vegetation determines canopy resistance (R c ):.")
26
Correct NLDAS transformation of UMD landuse class to SiB landuse class Noah LSM in NLDAS used UMD landuse map transformed to corresponding SiB classes (to allow use of Noah’s traditional SiB-based tables for the vegetation parameters) 12
 12")
27
Incorrect Noah LSM transformation of UMD landuse class to SiB landuse class mistakenly used in the NLDAS 4-model intercomparison production phase Tuning the Noah LSM in the NLDAS testbed with above mistake led to adoption of overly high LAI=5 value in Noah 2.7.1 (Note assignment of semi-arid “broadleaf shrubs with bare soil” class over the cropland region of midwest, northern and southern central plains) 12
 12")
29
NLDAS-Noah-2.7.1 Mean Jul 98 18Z Surface Latent Heat Flux LAI = 5 With correct veg type mapping With incorrect veg type mapping

30
With USGS landuse and STATSGO soils and their respective parameter tables LAI = 1LAI = 2 LAI = 3LAI = 4

31
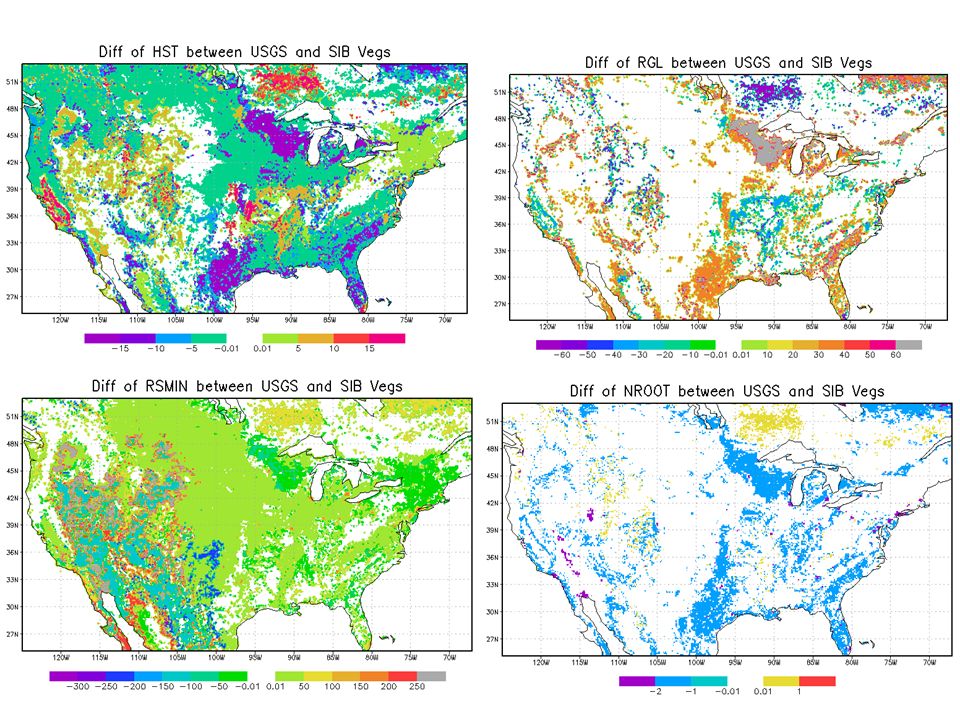
Impacts in NLDAS/Noah-2.7.1 of switching from SiB-based veg parameter tables to USGS-base veg parameter tables Using correct landuse map in both cases.

32
USGS / STATSGO: LAI = 4 SiB / Zobler: LAI = 4 Difference of top two panels.

35
Anticipated Upgrades in Unified Noah LSM Temporally varying annual cycle of LAI Dynamic vegetation model –Multi-layer vegetation canopy treatment Groundwater component More and thinner soil layers Multi-layer snowpack model

Similar presentations


 National Center.>")


>")

 Xubin Zeng (UA), Patrick Broxton (UA),>")


