Download presentation
Presentation is loading. Please wait.

1
Satellite Remote Sensing and Applications in Hydrometeorology Xubin Zeng Dept of Atmospheric Sciences University of Arizona Tucson, AZ 85721

2
http://www.atmo.arizona.edu/~zeng/zeng.html Fractional cover (Zeng et al. 2000, 2003) and green vegetation cover (Miller et al. 2006) Albedo/BRDF (Wang et al. 2004, 2005, 206) and snow albedo (Barlage et al. 2005, 2006) Vegetation root (Zeng et al. 1998; Zeng 2001) Precip intensity and freq. (Kursinski and Zeng 2006) Precip, water vapor, and monsoon (Zeng and Lu 2004) Veget. pattern and growth (X.D. Zeng et al. 2006a,b)
 and green vegetation cover (Miller et al. 2006) Albedo/BRDF (Wang et al. 2004, 2005, 206) and snow albedo (Barlage et al. 2005, 2006) Vegetation root (Zeng et al. 1998; Zeng 2001) Precip intensity and freq. (Kursinski and Zeng 2006) Precip, water vapor, and monsoon (Zeng and Lu 2004) Veget. pattern and growth (X.D. Zeng et al. 2006a,b).")
3
Tucson Landscape

4
NCAR/CLM3: FVC(x,y), LAI(x,y,t) NCEP/Noah: GVF(x,y,t),LAI=Const Validation: 1-3m spy sat data, 1-5m aircraft data, 30m Landsat data, Surface survey data Histogram of evergreen Broadleaf tree NDVI veg = 0.69 FVC vs LAI
, LAI(x,y,t) NCEP/Noah: GVF(x,y,t),LAI=Const Validation: 1-3m spy sat data, 1-5m aircraft data, 30m Landsat data, Surface survey data Histogram of evergreen Broadleaf tree NDVI veg = 0.69 FVC vs LAI")
5
FVC (x,y) LAI (x,y,t) Versus FVC (x,y,t) LAI = 4
 LAI (x,y,t) Versus FVC (x,y,t) LAI = 4")
6
Interannual variability and decadal trend of global fractional vegetation cover from 1982 to 2000

7
Global FVC Data

8
Data Impact

9
NDSI and NDVI

10
NLDAS GVF Data Noah 1/8 degree monthlyMODIS 2km 16-day

11
Application of MODIS Maximum Snow Albedo to WRF-NMM/NOAH up to 0.5 C decreases in 2-m Tair in regions of significant albedo change > 0.5 C increase in 2-m Tair in several regions

12
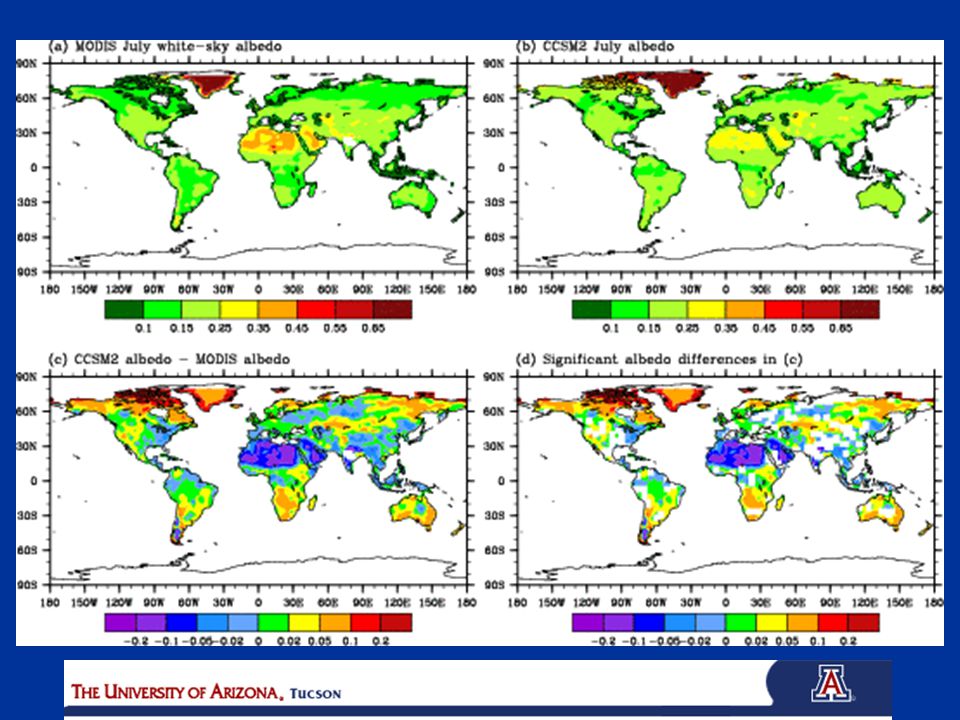
Land Surface albedo and its SZA dependence ECMWF: no SZA dependence NCEP: simple formulation NCAR (CLM3): two stream NASA (Catchment): simple fitting to two-stream In satellite remote sensing retrieval of solar fluxes, including ISCCP FD, UMD (Pinker; ISCCP C1), CERES TRMM: surface albedo adjusted to match computed TOA solar flux with satellite measurements
: two stream NASA (Catchment): simple fitting to two-stream In satellite remote sensing retrieval of solar fluxes, including ISCCP FD, UMD (Pinker; ISCCP C1), CERES TRMM: surface albedo adjusted to match computed TOA solar flux with satellite measurements")
13
Tsvetsinskaya et al. (2002)
")
16
The comparison of the MODIS blue-sky albedos with CERES/TRMM broadband albedos at 8 locations with different vegetation types from July 11-26, 1998. The MODIS BSA at 60 SZA for the 16-day period starting from Julian day 193 averaged from 2000 to 2004 are used.

17
Maximum snow albedo Maximum snow albedo is used as an end member of the interpolation from snow- to non-snow covered grids Current dataset is based on 1-year of DMSP observations from 1979 Current resolution of 1° Create new dataset using 4+ years of MODIS data with much higher resolution

18
MODIS Albedo Data (a) 1 km data in 10 deg tiles; global 0.05 deg (vs. 1 deg in RK) (b) seven narrow bands, VIS (0.4-0.7 microns), NIR (0.7-5 microns), SW (0.4-5 microns) (vs. SW from 0.4-1.1 microns in RK) (c) Day 49 of 2000 - Day 177 of 2004 (vs. 75 images in 1979 and 5 images in 1978) (d) Quality flags (e) MODIS data from both Terra and Aqua (f) Both albedo and BRDF
 (b) seven narrow bands, VIS ( microns), NIR (0.7-5 microns), SW (0.4-5 microns) (vs. SW from microns in RK) (c) Day 49 of Day 177 of 2004 (vs. 75 images in 1979 and 5 images in 1978) (d) Quality flags (e) MODIS data from both Terra and Aqua (f) Both albedo and BRDF.")
19
NDSI and Snow Albedo

20
Current Logic Structure NDSI > 0.4MODIS QC = good Global Maximum Snow Albedo Band 2 > 0.11 0.05 o MODIS Albedo Land Cover

21
Final 0.05° Maximum Snow Albedo

22
Application of MODIS Maximum Snow Albedo to NCEP Land Surface Model Up to 0.2 difference in high/mid latitudes can greatly affect surface energy balance, snow depth, and snow melt timing *Note: 0.05° maximum albedo dataset downscaled to 1° to compare with NOAH data *

23
Application of MODIS Maximum Snow Albedo to WRF-NMM/NOAH WRF-NMM Model: 10min(0.144°) input dataset converted from 0.05° by simple average; model run at 12km; initialized with Eta output; Winter simulation: 24hr simulation beginning 12Z 31 Jan 2006
 input dataset converted from 0.05° by simple average; model run at 12km; initialized with Eta output; Winter simulation: 24hr simulation beginning 12Z 31 Jan 2006")
24
Vegetation type-dependent vegetation root distribution

25
Offline simulation over the Amazon (deep roots maintain dry season ET)
")
26
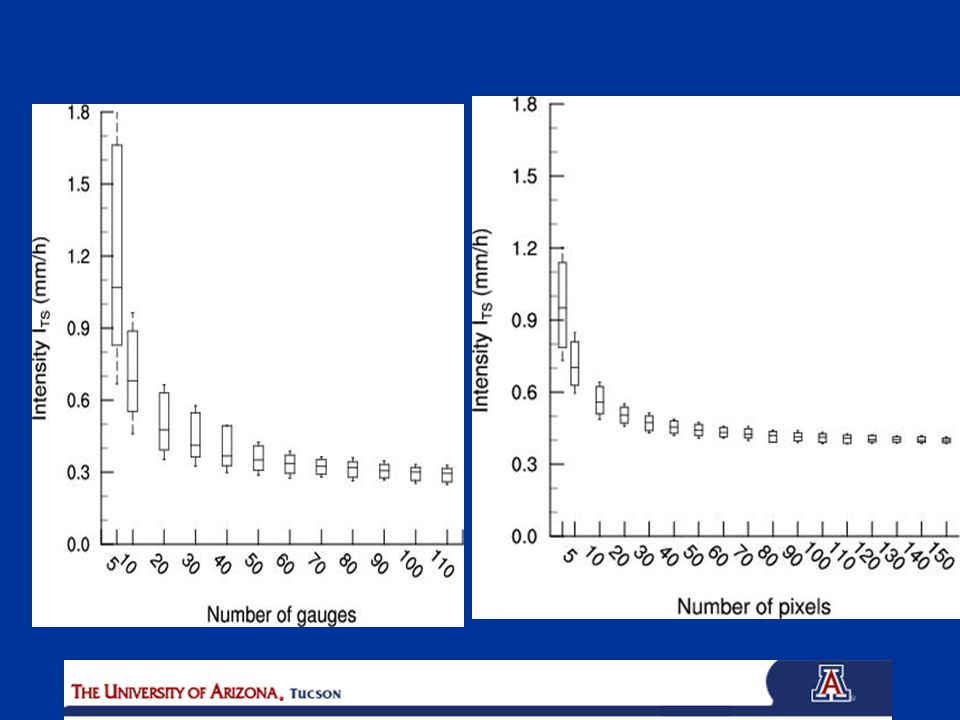
Precipitation intensity and frequency

28
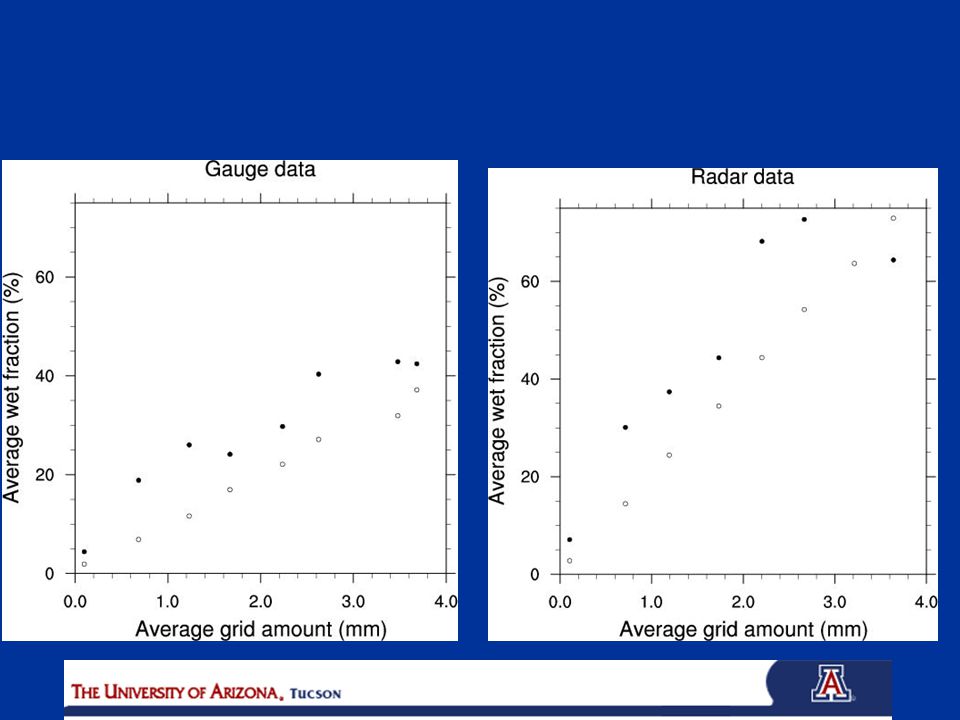
Gauge Radar

30
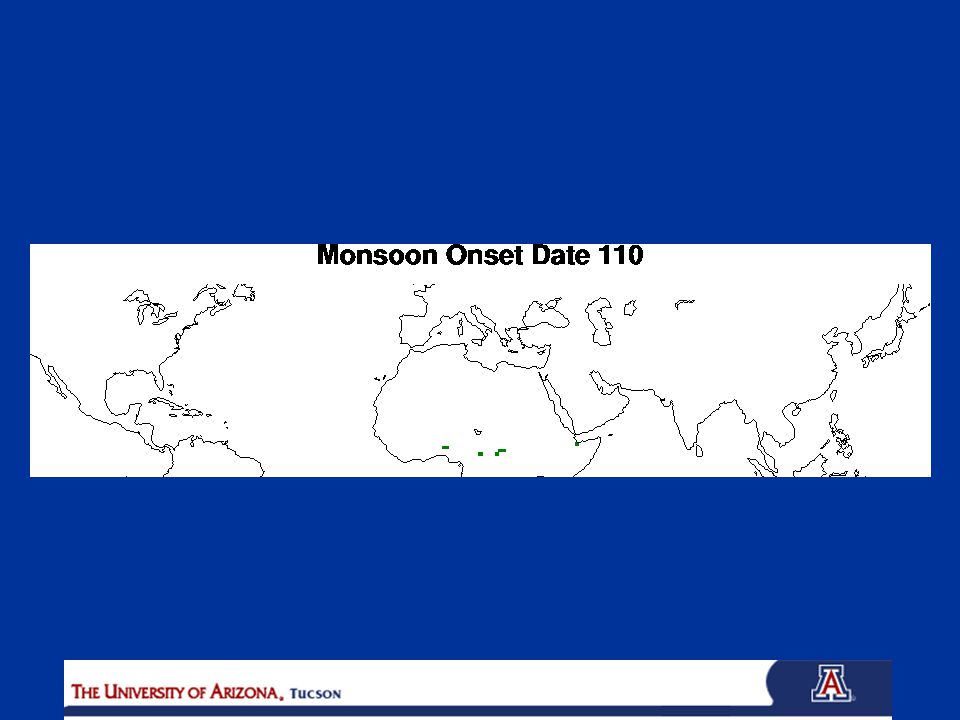
Monsoon Onset/Retreat Indexes Normalized precipitable water (PW) index: NPWI = (PW – PWmin)/(PWmax – PWmin) where PWmax and PWmin are the ten-year averages of the annual max and min daily PW at each grid cell. Proposed objective criterion: The monsoon onset (or retreat) date for grid cell G is defined as the first day (d) when NPWI is greater (or less) than the Golden Ratio (0.618) for 3 consecutive days in 7 of the 9 cells centered at cell G in day d or d±1. Explanations: `3 consecutive days’, `9 cells’, `Golden Ratio’
 date for grid cell G is defined as the first day (d) when NPWI is greater (or less) than the Golden Ratio (0.618) for 3 consecutive days in 7 of the 9 cells centered at cell G in day d or d±1. Explanations: `3 consecutive days’, `9 cells’, `Golden Ratio’.")
33
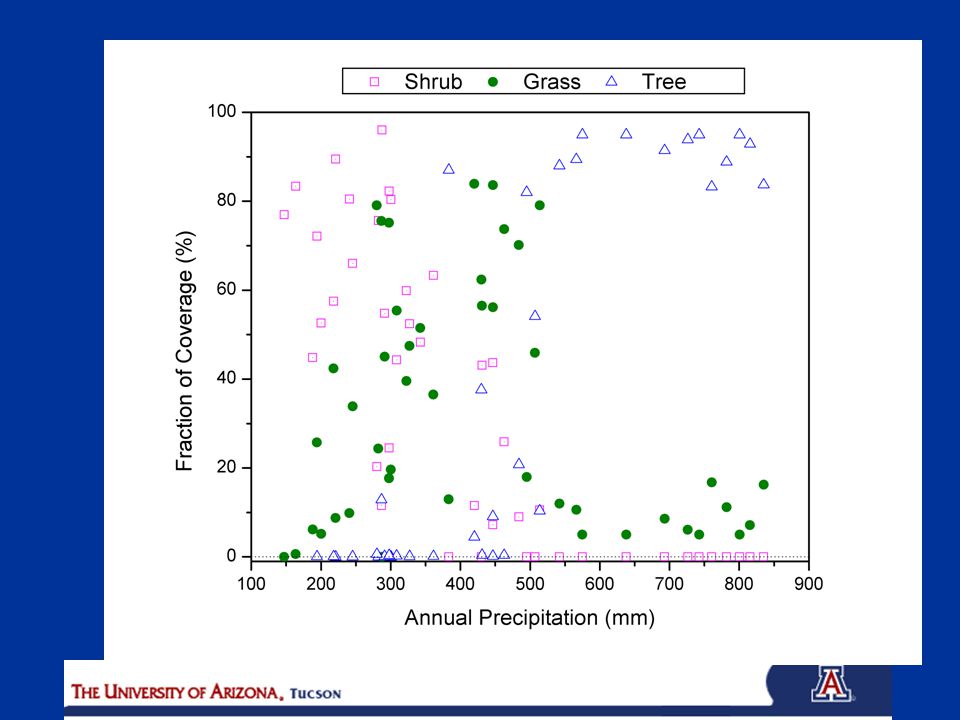
Dynamic vegetation and spatial patterns

34
Vegetation Pattern and Diversity (1) (2) (3) (4) (5) (6) (7)
 (2) (3) (4) (5) (6) (7)")
35
Annual Precipitation: 342 mm Annual Precipitation: 297mm

36
Annual Precipitation: 484mm Annual Precipitation: 542mm

Similar presentations


, snow water equivalent (SWE), soil freeze and vegetation status from satellite information,>")


, Ruth DeFries (1), Sandy Andelman (2), Rasolohery.>")

 Xubin Zeng (UA), Patrick Broxton (UA),>")

