Download presentation
Presentation is loading. Please wait.

1
Methods to allow analysis of change over time at small area level using census, vital statistics and other administrative data Paul Norman Centre for Census & Survey Research (CCSR) University of Manchester Thanks to: ESRC RES-163-25-0012 Understanding Population Trends & Processes ESRC CASE award S00429937028 Various co-authors
 University of Manchester Thanks to: ESRC RES Understanding Population Trends & Processes ESRC CASE award S Various co-authors")
2
Background: Research questions Spatial change: between areas & two or more time points … Has health improved? Are fertility rates falling? Is the ethnic diversity changing? Is the size of the population increasing or decreasing? Focus on: Aggregate, geographical, tabular data, England & Wales Latter part of 20th Century onwards Many issues also apply to: Surveys, microdata: Scotland & Northern Ireland, times Methods to allow … Data availability & definition issues Flag some data preparation aspects

3
Background: Data availability Socio-demographic data in computerised formats for a variety of geographies … Census 1971, 1981, 1991 & 2001 Vital Statistics 1981 onwards annually Administrative data Electorates (1980s) Benefits: Pension, Child, Incapacity (late 90s) Subnational population estimates Digital boundaries: GIS (1980s)
 Benefits: Pension, Child, Incapacity (late 90s) Subnational population estimates Digital boundaries: GIS (1980s)")
4
Potential problems Comparing results for areas at two or more time points … Inconsistency of: Geography Population base Variable detail Data availability

5
Administrative & Census geographies Nested hierarchy Nation (England & Wales) Government Office Region (9) Local Government (376) Ward (8,850) Output Area (175,434) SOA County
 Government Office Region (9) Local Government (376) Ward (8,850) Output Area (175,434) SOA County")
6
England & Wales Government Office Region Wards Local Authority District Output Areas Administrative & Census geographies

7
Geographical boundary change Local government reorganisation: districts change e.g. Unitary Authorities created from mid-1990s Small area population change leads to ward level change To maintain elector : councillor ratios Census smallest areas changed: Enumeration Districts EDs were unit of data collection & dissemination Output Areas (from 2001). Unit of dissemination. To maintain confidentiality & provide data detail for relatively homogenous areas
. Unit of dissemination. To maintain confidentiality & provide data detail for relatively homogenous areas.")
8
Geographies change over time

9
You need to compare like with like over time Regional analysis: Registrar Generals Standard Regions Government Office Regions District level analysis: Previous local government districts current districts Small area analysis: Wards: Carpet rarely nailed down New geographies for statistical reporting e.g. Super Output Areas (& Data Zones in Scotland) EDs OAs
 EDs OAs.")
10
Converting between geographies: using postcodes See Simpson (2002) and Norman et al. (2003) Convert: http://convert.mimas.ac.uk/ Haldens ward 1991 Haldens & Panshanger wards 2001
 Convert: Haldens ward 1991 Haldens & Panshanger wards")
11
Socio-demographic data & geography Unit of data collection: Invariably the individual or the household Units of data dissemination Rarely the individual Aggregated into geographical areas Confidentiality: tension between providing … If you need this data detail for this geography: estimation Detailed demographic data Coarse geographic scale Detailed geographic scale Banded demographic detail

12
Data definition & availability issues Census Vital Statistics Administrative records Official population estimates Lack of small area estimates

13
Population base Population definition From one census to the next may vary Usual residents, persons present, visitors Students at term-time address or parental domicile Be clear about your study population To look at change check populations are consistent Even when used as denominators can make a difference Total persons (or households) varies between census tables in the same year Household & communal establishment residents
 varies between census tables in the same year Household & communal establishment residents")
14
Ethnic diversity change Ethnic group question in both 1991 and 2001 Censuses Categories of groups different 1991: 7 tick box categories & 2 write in boxes Resulted in 35 ethnic categories Streamlined into 10 output categories 2001: 11 pre-coded boxes & 5 write-in options Included new categories of Mixed ethnic origin Resulted in a total of 16 categories N.B. Any other census questions / categories of answers can change

15
Ethnic diversity change

16
Vital Statistics (VS) Data on births, deaths, marriage & divorce Legal requirement (since 1838) in the UK to register births with 42 days and deaths within 5 days Computerised since 1980s VS uses … Calculating demographic rates as measures of fertility and mortality Input to population estimation methods & forecasting models to provide population age-sex counts Tables released with different … Main focus, demographic & geographic detail
 Data on births, deaths, marriage & divorce Legal requirement (since 1838) in the UK to register births with 42 days and deaths within 5 days Computerised since 1980s VS uses … Calculating demographic rates as measures of fertility and mortality Input to population estimation methods & forecasting models to provide population age-sex counts Tables released with different … Main focus, demographic & geographic detail")
17
Vital Statistics Demographic rates (by area and time point) Births data Crude birth rates General fertility rates Age-specific fertility rates Total fertility rates Deaths data Crude death rates Age-specific mortality rates Standardised mortality ratios Life Tables VS event counts Population at risk
 Births data Crude birth rates General fertility rates Age-specific fertility rates Total fertility rates Deaths data Crude death rates Age-specific mortality rates Standardised mortality ratios Life Tables VS event counts Population at risk")
18
Vital Statistics VS2: ASFRs in 2001 Baby boom High Low (until C21) Postponement
 Postponement")
19
Vital Statistics VS2: ASFRs Fertility change by LA district? VS2 since 1990: but … Geographical boundary changes Age of mother detail changes

20
Vital Statistics: population change Population estimates (for an area) Demographic components of change … P(t+n) = P(t) + B – D ± Net migration The VS provide the births and deaths components These update a base population P(t), e.g. the previous census Population forecasts Past & recent VS evidence informs rates used in projections Natural change

21
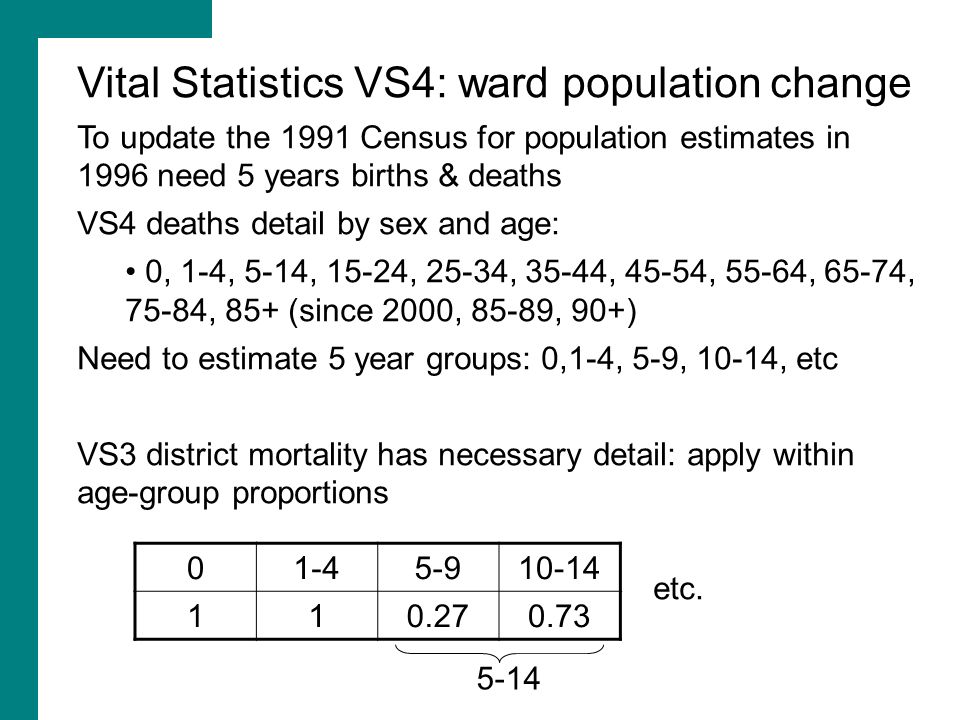
Vital Statistics VS4: ward population change To update the 1991 Census for population estimates in 1996 need 5 years births & deaths VS4 deaths detail by sex and age: 0, 1-4, 5-14, 15-24, 25-34, 35-44, 45-54, 55-64, 65-74, 75-84, 85+ (since 2000, 85-89, 90+) Need to estimate 5 year groups: 0,1-4, 5-9, 10-14, etc VS3 district mortality has necessary detail: apply within age-group proportions etc. 01-45-910-14 110.270.73 5-14
22
Administrative data Collected for a particular purpose but may have alternative applications in social / geographical sciences Electorates Child Benefit Pensioners Incapacity Benefit Severe Disablement Allowance

23
Electorates Denominator in calculating election turnout Indicator of sub-district population change Long time-series of annual data but … Subject to boundary change Collected 10th October Named the next year

24
Administrative data Child Benefit Pensioners Available from late 1990s Annual data for calendar year Can be used as indicator of population change with broad age detail Small area geographies, frozen 2003 wards & SOAs

25
Administrative data Incapacity Benefit Severe Disablement Allowance Available from late 1990s Annual data for calendar year Can be used as indicator of working age population health Small area geographies, frozen 2003 wards & SOAs

26
Populations Counts for population change Populations at risk: denominators Mid Year Estimates: provided by ONS Annual availability, 1981 onwards Nation, region, district geographies Back series revised following 2001 Census Time-series adjusted to 2001 district geography Downward adjustments to 1991 undercounts Affect previously calculated rates or population changes Events stay the same / Different denominator

27
Populations: small area Counts for population change Populations at risk: denominators Sub-district populations outside census years? Official estimates only recently available Ward level change during 1980s & 1990s? No easily available data You may need to estimate populations Time-consuming task

28
Populations: small area Estimating ward populations outside census years Simper method: apportionment, ratio, additive P(t+n) = P(t) ± change Indicated by size of electorate (child & pensioner claimants) More complex method: cohort component P(t+n) = P(t) + B – D ± Net migration Ageing on Births & deaths from VS4 Migration data a problem: Combine with simpler approach?
 = P(t) ± change Indicated by size of electorate (child & pensioner claimants) More complex method: cohort component P(t+n) = P(t) + B – D ± Net migration Ageing on Births & deaths from VS4 Migration data a problem: Combine with simpler approach")
29
JFMAMJJASOND Population estimates needed for the mid-year ONS mid-year estimates ElectorateCensusVital statistics Populations: small area Estimating ward populations outside census years May need to geographically & temporally harmonise inputs

30
Spatial change: between two or more time points Checklist … Are the datasets available for all time points? Is the study population the same definition? Are the answers to questions the same categories? Can the variable detail be made consistent? Has the geography changed? Methods to allow analysis of change over time? The smaller your areas, the greater your data preparation challenges!

31
Resources: examples Census change over time & data issues: Champion A G (1995) Analysis of change through time. In Census Users Handbook (ed. Openshaw S). GeoInformation International: Cambridge: 307-336 Dale A (1993) The content of the 1991 Census: change and continuity. In The 1991 Census Users Guide (eds. Dale A and Marsh C). HMSO: London: 16-51 Martin D, Dorling D & Mitchell R (2002) Linking censuses through time: problems and solutions. Area, 34: 82-91 Rees P, Parsons J & Norman P (2005) Making an estimate of the number of people and households for Output Areas in the 2001 Census. Population Trends Winter 2005, 122: 27-34 Consistent ethnic groupings Simpson L & Akinwale B (2007, in press) Quantifying stability and change in ethnic group. Journal of Official Statistics Simpson L. Ethnic group: identity and change 1991-2001 www.ccsr.ac.uk/research/egiac.htm
. GeoInformation International: Cambridge: Dale A (1993) The content of the 1991 Census: change and continuity. In The 1991 Census Users Guide (eds. Dale A and Marsh C). HMSO: London: Martin D, Dorling D & Mitchell R (2002) Linking censuses through time: problems and solutions. Area, 34: Rees P, Parsons J & Norman P (2005) Making an estimate of the number of people and households for Output Areas in the 2001 Census. Population Trends Winter 2005, 122: Consistent ethnic groupings Simpson L & Akinwale B (2007, in press) Quantifying stability and change in ethnic group. Journal of Official Statistics Simpson L. Ethnic group: identity and change")
32
Resources: examples Converting between geographies Simpson L (2002) Geography conversion tables: a framework for conversion of data between geographical units. International Journal of Population Geography 8: 69-82 Norman P, Rees P & Boyle P (2003) Achieving data compatibility over space and time: creating consistent geographical zones. International Journal of Population Geography. Vol 9, Issue 5, September-October 2003: 365-386 Geography & variable detail consistent over time: issues & usage Norman P (2004) Constructing a sociodemographic data time- series: computational issues and solutions. ESRC Research Methods Programme. Online: www.ccsr.ac.uk/methods/publications/ Rees P, Brown D, Norman P & Dorling D (2003) Are socioeconomic inequalities in mortality decreasing or increasing within some British regions? An observational study, 1990-98. Journal of Public Health Medicine. 25(3): 208-214
 Achieving data compatibility over space and time: creating consistent geographical zones. International Journal of Population Geography. Vol 9, Issue 5, September-October 2003: Geography & variable detail consistent over time: issues & usage Norman P (2004) Constructing a sociodemographic data time- series: computational issues and solutions. ESRC Research Methods Programme. Online: Rees P, Brown D, Norman P & Dorling D (2003) Are socioeconomic inequalities in mortality decreasing or increasing within some British regions. An observational study, Journal of Public Health Medicine. 25(3):")
33
Resources: examples Estimating time-series of small area populations Rees P, Norman P & Brown D (2004) A framework for progressively improving small area population estimates. Journal of the Royal Statistical Society A. Vol. 167 Part 1: 5-36 Data availability & usage Norman P & Bambra C (2005) The utility of medically certified sickness absence data as an updatable indicator of population health. Population, Space and Place (submitted) Simpson L (ed) (1998) Making Local Population Statistics: a Guide for Practitioners. LARIA: Wokingham CCSR training courses: http://www.ccsr.ac.uk/courses/ Demographic concepts & methods Population estimating & forecasting
 The utility of medically certified sickness absence data as an updatable indicator of population health. Population, Space and Place (submitted) Simpson L (ed) (1998) Making Local Population Statistics: a Guide for Practitioners. LARIA: Wokingham CCSR training courses: Demographic concepts & methods Population estimating & forecasting.")
Similar presentations


>")


 & Paul Ell (Queens University, Belfast)>")


 & ArcView GIS software? What is a Geographical Information System (GIS)? Introduction to ESRI ArcView 3.x.>")


