Download presentation
Presentation is loading. Please wait.

1
Bayesian methods for small area estimation and spatial analysis Juanjo Abellan Small Area Health Statistics Unit (SAHSU) Department of Epidemiology & Public Health Imperial College London Joint work with David Briggs, and Daniela Fecht ESRC Research Methods Festival, Oxford, 17-20 July 2006
 Department of Epidemiology & Public Health Imperial College London Joint work with David Briggs, and Daniela Fecht ESRC Research Methods Festival, Oxford, July 2006")
2
Outline Part I: Bayesian small area estimation in Epidemiology: Disease mapping A Bayesian approach Part II: Bayesian Spatial analysis of SES indices The English indices of deprivation (2004) Spatial analysis of income, employment and education domains.
 Spatial analysis of income, employment and education domains.")
3
Part I: Bayesian small area estimation in Epidemiology

4
Disease mapping Aim: to analyse the geographical variation of disease risk Geographical data: region of interest divided into a certain number N of areas. Data on the disease of interest: Number of observed cases O i, i=1,...,N. Number of expected cases E i, i=1,...,N. Disease risk measure: Standardised Incidence Ratio SIR i =O i /E i, i=1,...,N.

5
Disease mapping: an example Disease: Hip fracture incidence in males aged 85+ Period: 1998-2000 Geographical level: District Risk indicator: SIR i =O i /E i

6
Statistical formulation If we assume: Then, the Maximum Likelihood Estimator is:

7
A few problems... When working with small areas or rare diseases: SIR=O/E may become unstable: extreme risks associated to low populated areas SE(SIR) proportional to 1/ E: significant risks associated to highly populated areas Areas next to each other might show completely opposite risks
 proportional to 1/ E: significant risks associated to highly populated areas Areas next to each other might show completely opposite risks.")
8
For example... PopOESIRCI95% Lower CI95% Upper 184 2014 3723 880.411.131.091.16 52389.790.820.151.38

9
A Bayesian approach Besag et al (1991) proposed the following Bayesian hierarchical model: 1st layer: Model 2nd layer: Priors 3rd layer: Hyperpriors
 proposed the following Bayesian hierarchical model: 1st layer: Model 2nd layer: Priors 3rd layer: Hyperpriors")
10
Raw vs Smoothed Risk

11
Shrinkage

12
Example...continued PopOESIRCI95% Lower CI95% Upper 184 2014 3723 880.411.131.091.16 52389.790.820.151.38 Smoothed RR Q 2.5%Q 97.5% 1.050.931.19 0.890.571.29

13
Uncertainty?

14
Discussion The Bayesian approach is a very natural framework for random effects. The inclusion of random effects allows to accomodate overdispersion. The inclusion of spatially structured random effects allows for borrowing information accross areas. This model has been widely used in the last decade and has proved to be very robust.

15
Part II: Bayesian spatial analysis of SES indicators

16
Traditionally, in the UK, SES has been measured by relatively simple indices (Carstairs) More complex measures have been developed recently, designed to capture the multidimensional nature of deprivation. An initial series of country-level indices of multiple deprivation (IMDs) was developed in 2000. These have now been revised and extended to provide a new set of IMDs in England, Wales and Scotland. These indices not only use a wider range of variables, arranged in a series of separate domains, but also draw upon a wide variety of different (non-census) data sources. As such they provide the opportunity to recognise and represent different dimensions of deprivation, and perhaps better to characterise some of the complexity inherent in socio-economic associations with health. Background
 was developed in These have now been revised and extended to provide a new set of IMDs in England, Wales and Scotland. These indices not only use a wider range of variables, arranged in a series of separate domains, but also draw upon a wide variety of different (non-census) data sources. As such they provide the opportunity to recognise and represent different dimensions of deprivation, and perhaps better to characterise some of the complexity inherent in socio-economic associations with health. Background.")
17
IMD2004 in England It was derived from 37 variables arranged in seven domains: 1.Income 2.Employment 3.Education 4.Health deprivation and disability 5.Barriers to housing and services 6.Living environment 7.Crime Primary factors

19
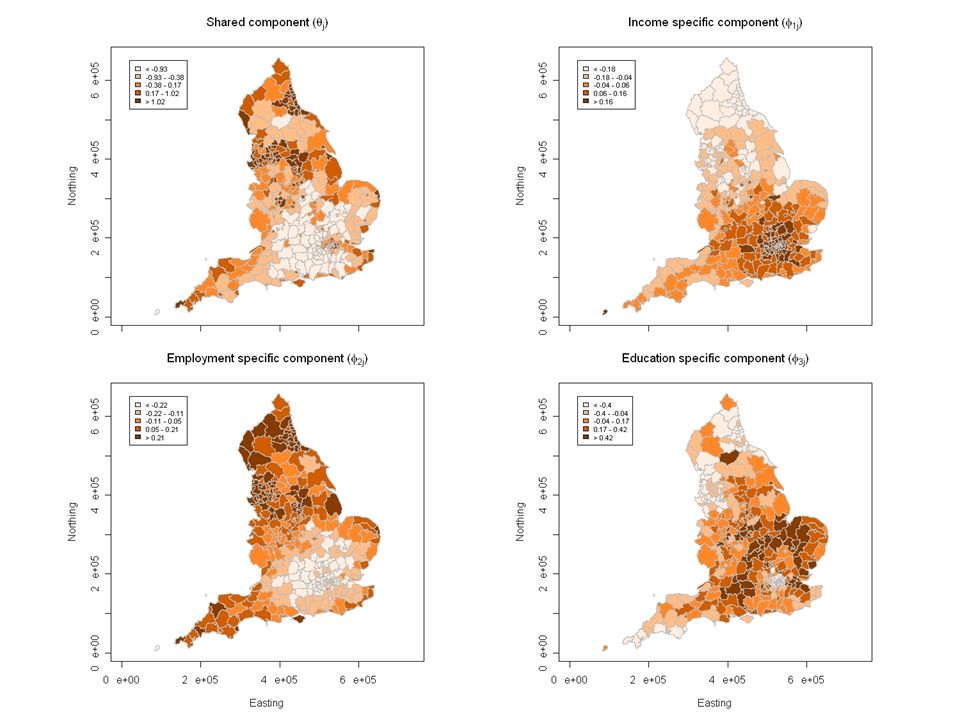
What do they have in common? Correlations IncomeEmploymentEducation IMD0.970.940.81 Income0.910.78 Employment0.79 To analyse their respective geographies (at district level); specifically, to extract their common patterns by splitting them into shared and specific components
; specifically, to extract their common patterns by splitting them into shared and specific components.")
20
A Bayesian spatial model 1st layer: Model 2nd layer: Priors 3rd layer: Hyperpriors

22
Variance explained and correlations Shared comp. Specific Income Specific Employ Specific Educat Residual Income Residual Enploy Residual Educat Variance 2.5880.1110.0920.5820.0030.0010.055 % Var 75.423.222.6716.960.100.021.61 Correlations Specific Income Specific Employment Specific Education Shared -0.300.57-0.38 Specific Income -0.85-0.06 Specific Employment -0.36

23
Discussion We split the three scores into four components, one shared by all of them and one specific to each of them. That common geography explained 75.42% of the total variability in the scores, and turned out to be very similar to the IMD itself. The specific patterns of the three domains have less relevance in terms of the proportion of variance (all together explain 22.85% of the variance). They reflect very different patterns, of which income and employment are rather antagonistic. This decomposition can potentially be very useful to assess inequities in health in relation to SES, as we can consider the shared component or a specific one, or a combination of them. The results we obtained in this study merit further investigation and analyses.
. They reflect very different patterns, of which income and employment are rather antagonistic. This decomposition can potentially be very useful to assess inequities in health in relation to SES, as we can consider the shared component or a specific one, or a combination of them. The results we obtained in this study merit further investigation and analyses..")
24
Thanks for you attention!

Similar presentations


 Households Below Average Income ESDS Government FRS.>")


 Centre for Health Economics University of York.>")


