Download presentation
Presentation is loading. Please wait.

1
Water Resources and Water Accounts in Mauritius Workshop on Water Acounts and Statistics for North African French Speaking Countries, Rabat, Morocco (11 -13 September 2012) Presented by: D. Deepchand and Y.Thorabally Mauritius September 2012

2
Contents Physiography General Information Water Resources and Hydrology Water use by sectors Water Accounts 2

3
Physiography 3 Mauritius

4
Volcanic Formation 2 Volcanic activities -10 million years - 25,000 years ago.

5
Mauritius 5

6
General Information The island is of volcanic origin. The volcanic activity of the island ended about 25,000 years ago. Population: 1.27 Million Area of Mauritius: 1865 km 2 Major Climatic Conditions: Sub Tropical Summer & Winter Sources of water supply: Surface water & Groundwater 6

7
Country’s Water Profile The Water Cycle… from clouds to sea.. from sea to clouds…

8
RAINFALL PATTERN 3600 mm 3000 mm 2000 mm 1000 mm Precipitation mm Average Annual Rainfall = 2000 mm Summer = 1340 mm Winter = 660 mm 6

9
9 Area of Mauritius: 1865 km 2 Annual average rainfall: 2000 mm Annual volume of raw water: 3700 Mm 3 Estimated water utilisable potential (33%) : 1250 Mm 3 Water Balance
 : 1250 Mm 3 Water Balance")
10
The water cycle overview in Mauritius Adapted from: http://watercycle.gsfc.nasa.gov/ 30%100% 60% 10%

11
Surface water resources 6 impounding reservoirs total capacity = 77.4 Mm 3 annual yield = 135 Mm 3 6 Potable Water Treatment Plants 3 major river abstractions (for Potable Water Supply ) Groundwater resources 406 wells 11 Water Resources
 Groundwater resources 406 wells 11 Water Resources")
12
Hydrological data Surface water - 25 major river basins ◦ 107 Flow measuring station ◦ 350 river run off takes Groundwater - 5 main aquifers ◦ 300 Observation Wells ◦ 114 potable (90 % of total G/w production ) ◦ 156 private agricultural (5%) ◦ 136 Industrial (5%) 12
 ◦ 156 private agricultural (5%) ◦ 136 Industrial (5%) 12")
13
13 Water Stress: A supply less than 1700 m 3 /person/yr Water Scarce: A supply less than 1000 m 3 /person/yr (UNDP 1998) Today Mauritius is already water stressed. (actual supply is 1028 m 3 /person/yr ) By 2025 Mauritius will be water scarce. (supply expected to drop to 862 m 3 /person/yr ) Water Stress & Water Scarcity
 By 2025 Mauritius will be water scarce. (supply expected to drop to 862 m 3 /person/yr ) Water Stress & Water Scarcity.")
14
WATER UTILISATION (Million cubic metres per year) Year 2009 Purposes Surface Water GroundwaterTotal River-run Off-takes Storage Municipal (Domestic, Industrial & Tourism) 36 * 76111223 Industrial (Surface- Groudwater) 5-510 Agricultural (including Water Rights) 32074 * 7401 Hydropower199169 * -368 OVERALL UTILISATION5603191211000* TOTAL WATER MOBILISATION 524254121899 * includes 101 Mm 3 used for irrigation/potable purposes after hydropower generation at Réduit. Magenta, Tamarind Falls and power generation at Le Val and La Ferme, twice. 7

15
Statistics Mauritius is the official organisation responsible for collection, compilation, analysis and dissemination of the official statistical data relating to the economic and social activities of the country. It releases the following publications on a regular basis: Economic & Social Indicators Digests of Statistics Census & Survey reports Mauritius in Figures 15

16
Statistics Mauritius operates under the Statistics Act 2011, which defines, among other things, the statistical office tasks, its authority to collect data and the confidentiality of individual information. The Statistics Act also created a Statistics Advisory Council (SAC) that assembles representatives of all main stakeholders in Mauritius’s statistics. The SAC advises on priorities, the formulation of work programs and quality aspects of Mauritius’s statistics 16
 that assembles representatives of all main stakeholders in Mauritius’s statistics. The SAC advises on priorities, the formulation of work programs and quality aspects of Mauritius’s statistics 16.")
17
Status of Water Accounts Statistics on water available were available for more than 20 years, though works on water accounting started some 5 years back through the technical assistance of a consultant with the support of UNDP and AFD. A pilot exercise was also carried out with support of SADC: Two water accounts, - water assets and physical supply and use accounts compiled 17

18
Status of Water Accounts Presently Statistics Mauritius is further developing the water accounts so that a more or less complete set of water accounts are made available. Reference manual: The SEEA water and the IRWS Coverage of the water accounts” The water cycle Abstractions by source Losses Use by economic sectors and households 18

19
Water Accounts Data Sources: ◦ Census of Economic Activities, CSO ◦ Water Resources Unit ◦ Central Water Authority – Water Supplier ◦ Wastewater Management Authority

20
Potable Water Use by sectors Potable Water Use by sectors Domestic -66% Industrial (manufacturing) - 8% Commercial - 8% Tourism - 5% Vegetables -6% Govt. Buildings -5% Others -2% 20

21
Economic Evolution 21 TimePer capita income Economy% GDP Year1968 (At independence) US$260Sugar-cane monocrop6.8% PresentUS$6700Sugar, manufacturing and tourism 23.6%
 US$260Sugar-cane monocrop6.8% PresentUS$6700Sugar, manufacturing and tourism 23.6%")
22
22 Potable water VolumeM 3 Tariff- US$ Domestic Non domestic 1 st - 100.151 st - 100 commercial 0.42 Tourism 0.60 I ndustry 0.33 Next 50.18Next 1500.530.800.40 Next 50.25All add..0.701.000.53 Next 100.32 Next 200.45 Next 500.60 Next 1000.80 All additional1.00 Waste water Tariff First 100.18All0.67 Next 100.22non Next 300.50Domestic All additional1.13

23
Economic Accounting For Water Water Asset Account & Physical Supply and Use accounts have been compiled and used to calculate indicators: Water use intensity Water productivity 23

24
Water Use Intensity: Water Use Intensity: amount of water required to produce one unit currency 24 SectorWater intensity Average for Economy 40litres/US$ Agriculture820 litres/US$ Industry4.2 litres/US$ Agriculture requires: 20 times more water as compared to the average for whole economy 200 times more water as compared to industry Source: SADC Economic Accounting of Water Use Account

25
Water Productivity Water Productivity: contribution of water to economy 25 SectorWater Productivity Average for Economy 27.41 US$/m 3 Agriculture0.38 US$/m 3 Industry236.74 US$/m 3 Average Economy contributes 70 times more than agriculture Industry contributes 600 times more than agriculture Source: SADC Economic Accounting of Water Use Account

26
Water use and economic contribution Agriculture uses 67.7% of water but contributes to 10% of employment and 6% of GDP 26

28
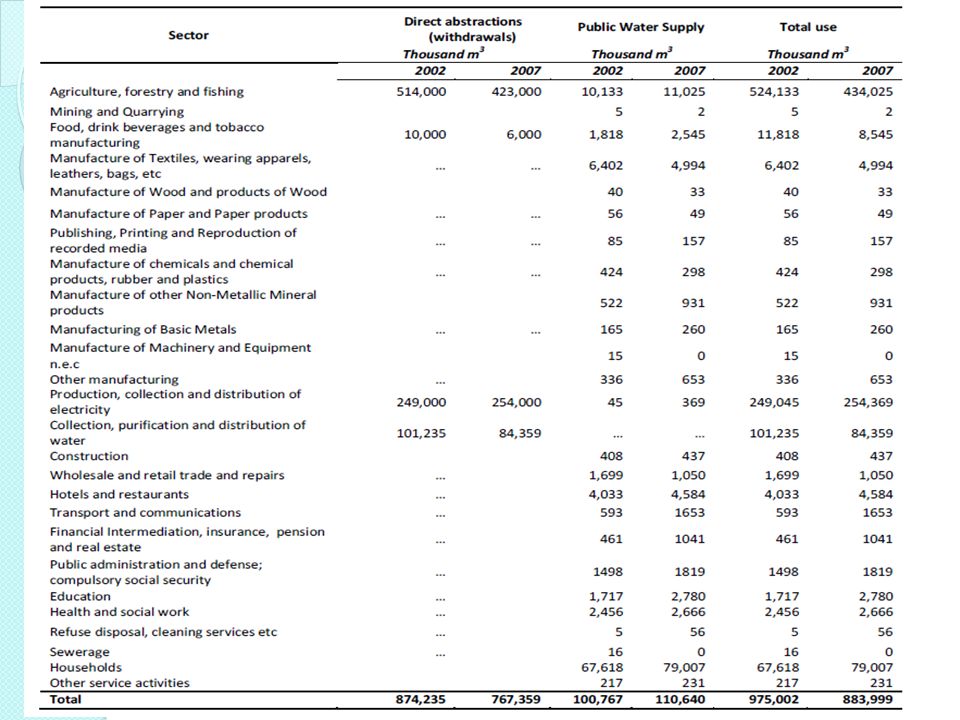
Water Accounts Source: CSO Sector Direct abstractions (withdrawals) PublicWater Supply Total use Gross Value Added Water efficiency Thousand m 3 3 3 Rupees Million Gross Value Added/water use Agriculture, forestry and fishing 514,000 10,133 524,133 79,090 0 Mining and Quarrying 5 5 81 16 Food, drink beverages and tobacco manufacturing 10,000 1,817 11,817 7,566 1 Manufacture of Textiles, wearing apparels, leathers, bags, etc … 6,402 12,935 2 Manufacture of Wood and products of Wood 40 142 4 Manufacture of Paper and Paper products … 56 316 6 Publishing, Printing and Reproduction of recorded media … 93 1,150 12 Manufacture of chemicals and chemical products, rubber and plastics … 424 1,546 4 Manufacture of other Non-Metallic Mineral products 522 1,012 2 Manufacturing of Basic Metals … 165 1,220 7 Manufacture of Machinery and Equipment n.e.c 15 268 18 Other manufacturing … 336 2,071 6 Production, collection and distribution of electricity 249,000 45 249,045 3,012 0 Collection, purification and distribution of water 101,235 … 634 0 Construction 435 7,168 16 Wholesale and retail trade and repairs … 1,858 14,728 8 Hotels and restaurants … 4,084 8,923 2 Transport and communications … 664 16,944 26 Financial Intermediation, insurance, pension and real estate … 504 16,614 33 Public administration and defense; compulsory social security … 283 238 8,140 34 Education … 2,117 5,603 3 Health and social work … 2,147 3,812 2 Refuse disposal, cleaning services etc … 6 6 636 106 Sewerage … 17 … 0 Households 67,618 … …
 PublicWater Supply Total use Gross Value Added Water efficiency Thousand m Rupees Million Gross Value Added/water use Agriculture, forestry and fishing 514,000 10, ,133 79,090 0 Mining and Quarrying Food, drink beverages and tobacco manufacturing 10,000 1,817 11,817 7,566 1 Manufacture of Textiles, wearing apparels, leathers, bags, etc … 6,402 12,935 2 Manufacture of Wood and products of Wood Manufacture of Paper and Paper products … Publishing, Printing and Reproduction of recorded media … 93 1, Manufacture of chemicals and chemical products, rubber and plastics … 424 1,546 4 Manufacture of other Non-Metallic Mineral products 522 1,012 2 Manufacturing of Basic Metals … 165 1,220 7 Manufacture of Machinery and Equipment n.e.c Other manufacturing … 336 2,071 6 Production, collection and distribution of electricity 249, ,045 3,012 0 Collection, purification and distribution of water 101,235 … Construction 435 7, Wholesale and retail trade and repairs … 1,858 14,728 8 Hotels and restaurants … 4,084 8,923 2 Transport and communications … , Financial Intermediation, insurance, pension and real estate … , Public administration and defense; compulsory social security … , Education … 2,117 5,603 3 Health and social work … 2,147 3,812 2 Refuse disposal, cleaning services etc … Sewerage … 17 … 0 Households 67,618 … …")
29
MAJOR CHALLENGES Climate change leading to: –Reduction in the average rainfall -Reduction of 10% over 30 years –more occurrence of short duration high intensity rainfall-flash floods –Sea level rise impacting on the groundwater quality in the coastal regions Low coverage of sanitation facilities: –Degradation of raw water quality -Public Sewerage Coverage presently 30% to reach 50%by 2015 Industrial development : –Control of Discharge of effluent into open environment- Enforcement of effluent Discharge Regulations Non Revenue Water: –Reduction of NRW to acceptable level- 2000 km of old CI,Ac,Steel pipes to replace-Cost 400 M US$

30
Socio-Economic Development and the Environment –Finite & vulnerable natural resource –Social & economic good Drinking and Sanitation –Access to safe water supply – Practically 100% –Integrated sanitation & water supply services - Practically 100% Agriculture and Food Security –Sustainable irrigated agriculture –Increase in water use efficiency –Re-use of treated effluent Energy Development –Use of hydro-power – 5% of total energy Industrial Development –Water at economic value Environment –Control of quality of effluent discharged into water bodies flow GENERAL & SECTORAL POLICIES

31
Conclusion The challenge for water accounting is to have all the above 31

32
Thank 32 You …

Similar presentations