Download presentation
Presentation is loading. Please wait.

1
www.irannovation.com Rubin Pajoohan Fartak co. International Engeenering

2
What are minerals? Why is mining important? Geography of mining Demand for minerals Reserves and resources www.irannovation.com

3
Metals are chemical elements that conduct electricity. In nature, they occur in the form of minerals, which are chemical compounds containing metals and with specific chemical and physical characteristics. Minerals occurring in sufficient quantity and grade to be economically exploitable are called ores. www.irannovation.com

4
www.irannovation.com

5
Aluminium: T ransport, packaging, construction, high tension power lines Copper: Electrical conductors, construction, transport Gold: Investment, jewellery, electronics Lead: Batteries, pigments, ammunition, radiation shielding Nickel: Stainless steels, electroplating Platinum: Jewellery, catalysts Silver: Electronics, sterlingware Tin: Tinplate in packaging, solder, pigments Zinc: Galvanizing, brass and bronze www.irannovation.com

6
MetalShare in total value of metallic mineral production % (estimates) Volume of output (metal content in kilotonnes) Iron ore21.9800 000 Copper18.016 900 Gold13.53 Nickel4.91 300 Zinc3.410 300 Bauxite1.531 000 Others36.8.. All metals100.0.. www.irannovation.com

7
Around twenty developing countries depend on mining for more than half their export income – and the number is increasing Ease of entry into mining No need to mobilize domestic capital Easy access to technology No need for government financed infrastructure Easy market access Transparent and simple standards Minimal need for marketing Scale of revenues The world’s largest mines generated annual sales of more than US$ 12 billion, annual profits of more than US$ 8 billion in 2006-2007 Governments can easily appropriate rents www.irannovation.com

8
www.irannovation.com

9
YEAR 2005 TOTAL ~ 910 billion USD Source: Raw Materials Group, Stockholm 2006. www.irannovation.com

10
YEAR 2005 TOTAL ~ 250 billion USD www.irannovation.com

11
www.irannovation.com
12
GLOBAL MINING – GEOGRAPHY 1990

13
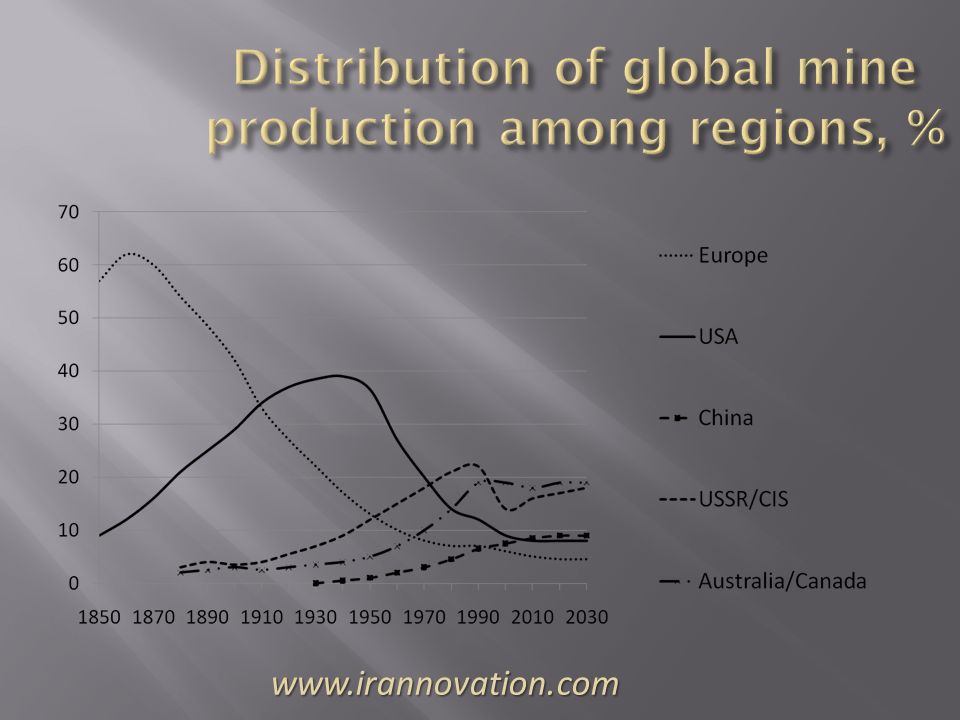
1. China 10.1%

14
www.irannovation.com

15
% of total value of non-fuel mineral productionat the mine stage www.irannovation.com

16
www.irannovation.com
17
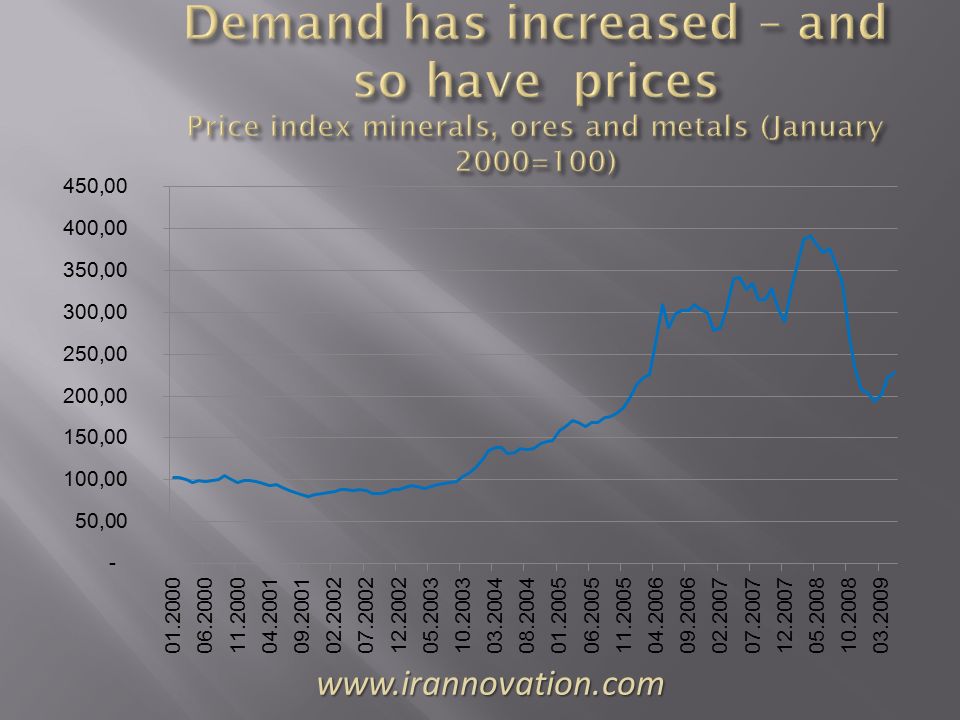
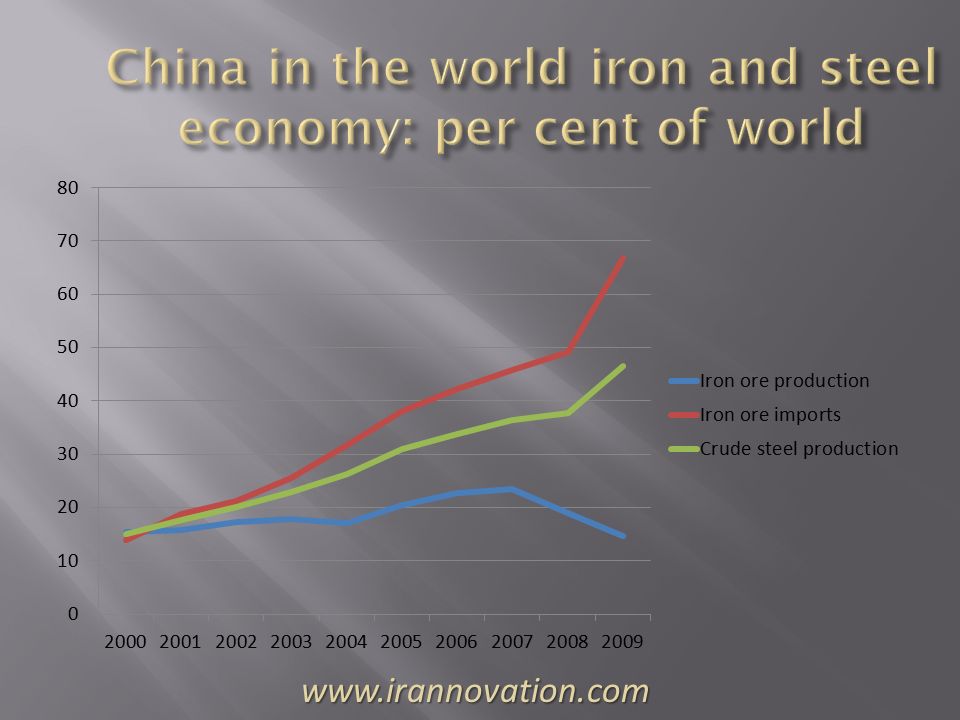
Asian minerals and metals demand has grown very rapidly and Asian countries have accounted for almost all of the increase in demand over the past five years China is now the world’s largest steel producer, steel consumer, steel exporter and iron ore importer, the world’s third largest iron ore producer and the third largest steel importer Metals use per capita is still very low in countries such as China and India, but they are still at a stage where metals consumption relative to GDP is rising and large populations make them more than significant forces on the market www.irannovation.com

18
www.irannovation.com
19
Demand will continue to be strongly linked to Asian growth and high rates of increase are expected Once the recovery from the recession is completed, capacity is expected to just keep up with growth in demand in the long term (next 8-10 years) A large share of output growth will take place in developing countries (Africa and Latin America), where there is now strong investor and exploration interest www.irannovation.com
 A large share of output growth will take place in developing countries (Africa and Latin America), where there is now strong investor and exploration interest")
20
MetalShare of value added, % Gold100 Platinum Group Metals100 Tin83 Copper77 Lead77 Nickel70 Zinc63 Cobalt33 Bauxite/aluminium9 www.irannovation.com

22
www.irannovation.com
23
www.irannovation.com

24
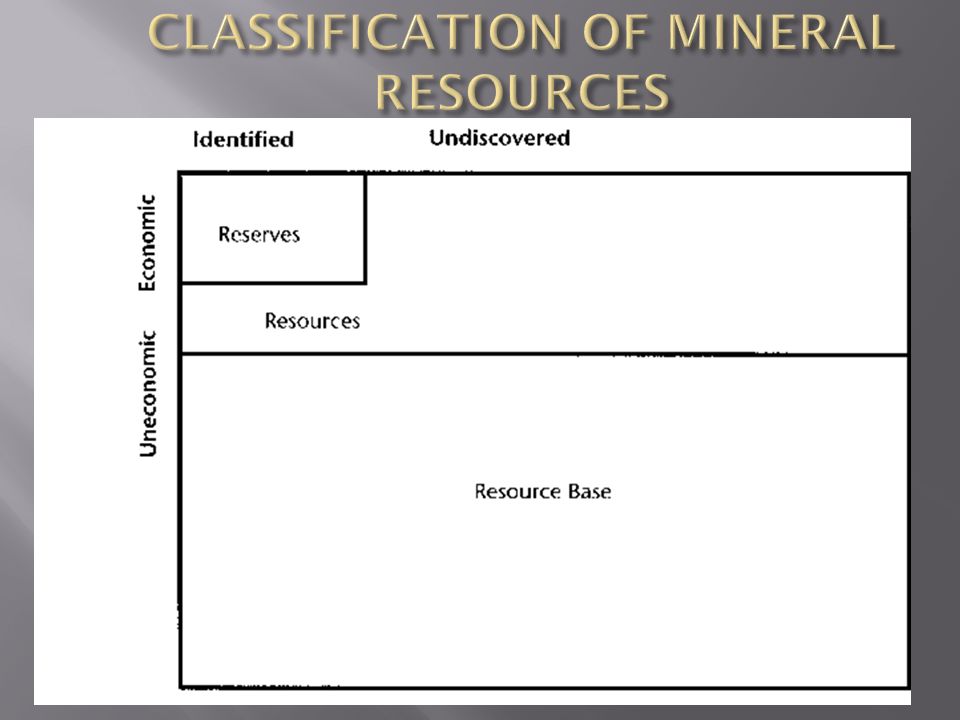
ReservesResource base Aluminium811065 Copper22736 Iron65886 Lead17607 Nickel30526 Silver15731 Tin28759 Zinc20778 www.irannovation.com

25
ASSUMPTIONS Metals use has increased by 5 % annually in the past and continues to do so until year 5; from year 6 to year 15, metals use grows at an annual rate of 20 %; from year 16 to year 24 it grows at 10 %; from year 25 to 35 it is constant; from year 36 onwards it declines by 2 % per year The average life of metal containing products is 15 years 67 % of the metal in a product can be recycled.

26
Hotelling: Mineral prices should rise at the same annual rate as the rate of interest – if the price increase is lower, then more should be produced, if higher, resources should be left in the ground However, technology changes and new resources are discovered Over most of human history, real mineral prices have declined – technological progress has offset depletion Is the trend about to change? www.irannovation.com
Similar presentations