Download presentation
Presentation is loading. Please wait.

1
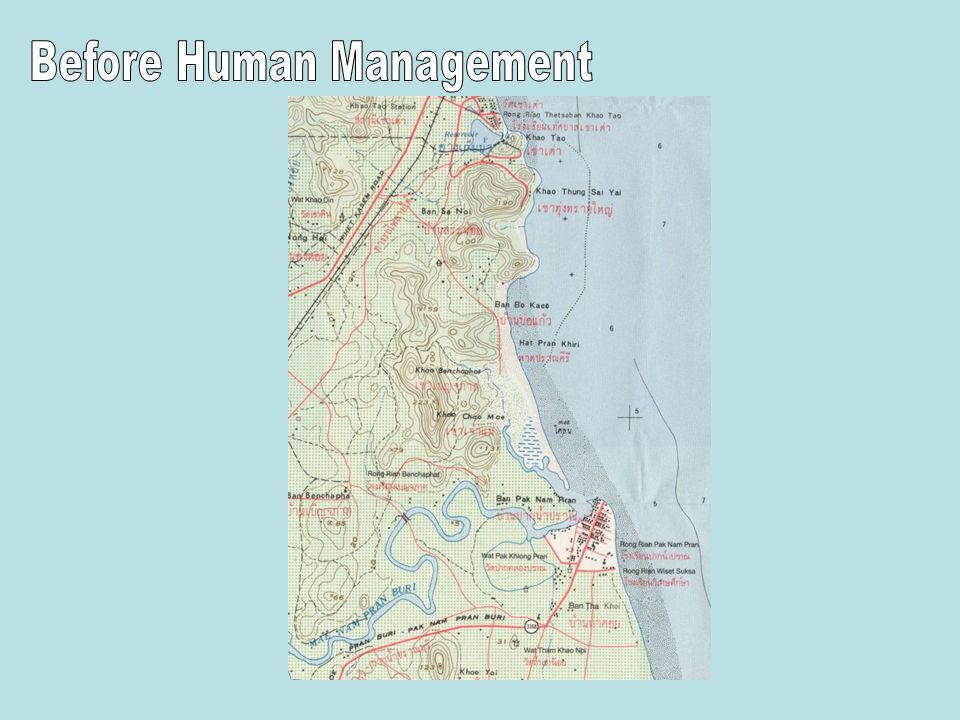
A study of 2 sites along the Hat Pran Khiri stretch of coastline whereby coastal management has taken place and one whereby no management has been used and a study of the beach at the hotel which has no coastal management. The aim is to view the effects of coastal management on the coastal processes of erosion, transportation and deposition. You are going to perform a variety of tasks when you arrive at each site and it is important that your data is well collected. As well as the suggested techniques, you must also think of any additional ways of collecting the data. Make a note of the methods in which you collected each piece of data. This will help you with your write up when you get back to class.

2
The aim of this project is to investigate the coastal processes of erosion, transport and deposition which may be occuring, the nature of the human intervention at the coast and what effects these interventions may have on the coastal processes and the nature of the sediment at the coast. Then we should be able to answer these questions: What is the nature of the beach ? – what is it’s shape ? Does this shape change as you go along it ? What is the material like on the beach ? Does it change as you go along it? If so, how ? What are the coastal processes operating her ? What types of waves do we have ? Is there erosion or deposition ? Is there longshore drift ? What are the human interventions at the coast? How big or small are they? What are they like? Where have they been built? Why have they been built ? What effects do they appear to have on the nature of the beach and the coastal processes ?

4
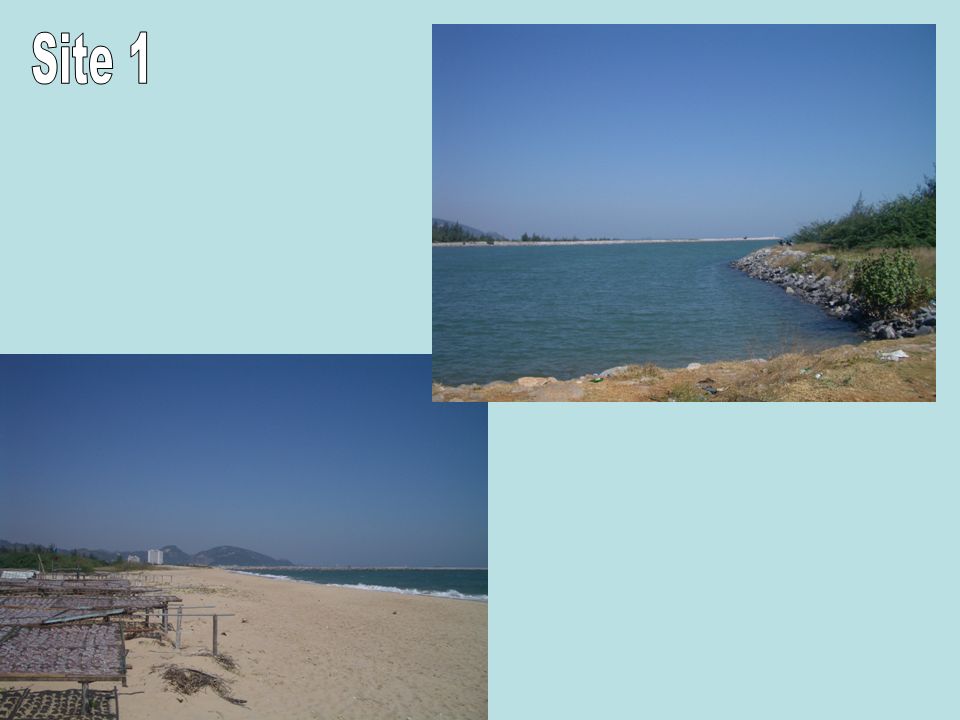
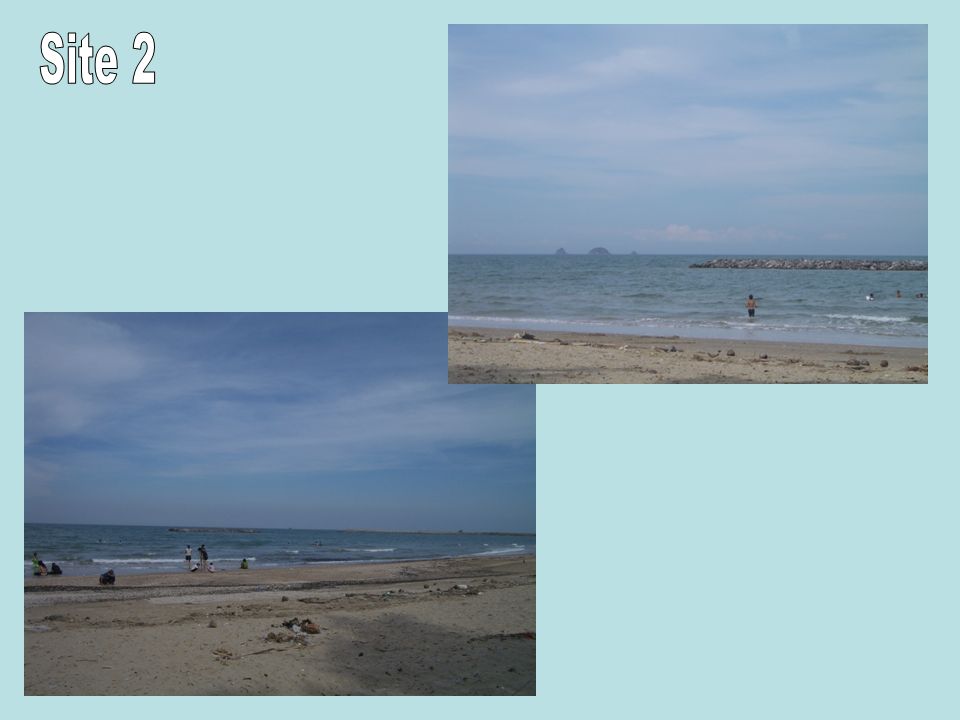
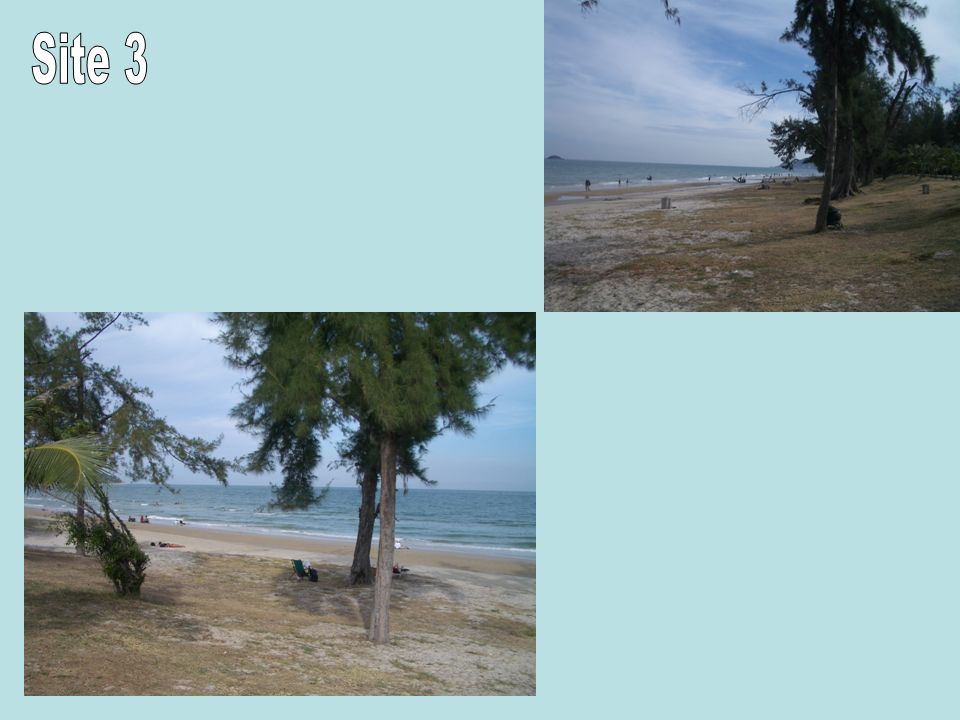
Site 1 (Pak Nam Pran) Site 2 (Pranburi forest park) Site 3 is further up the coastline (Suan Son resort )
 Site 2 (Pranburi forest park) Site 3 is further up the coastline (Suan Son resort )")
8
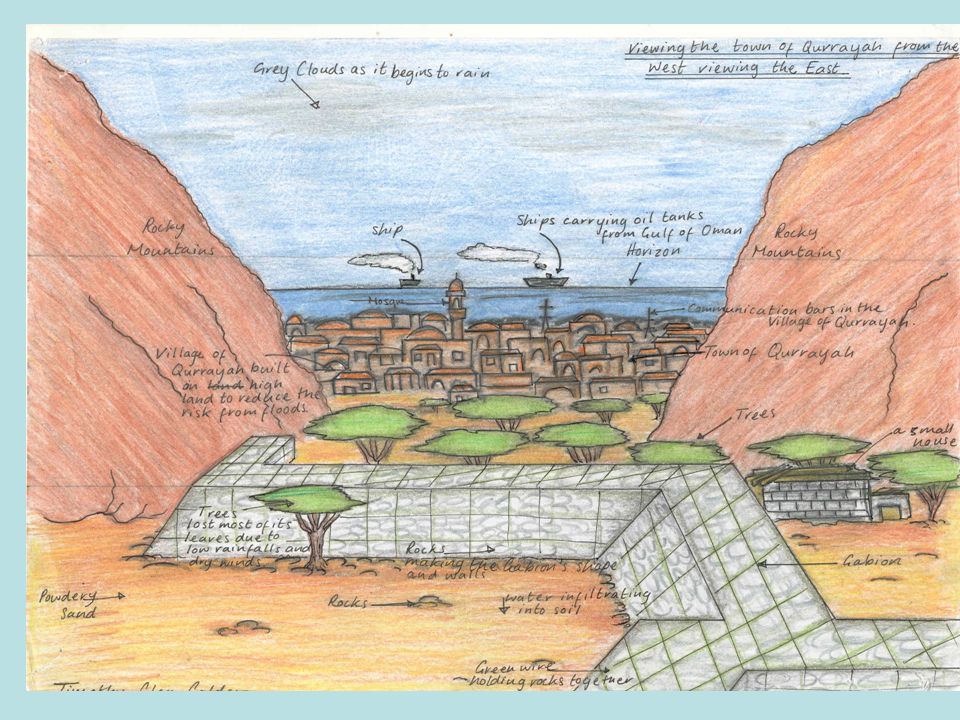
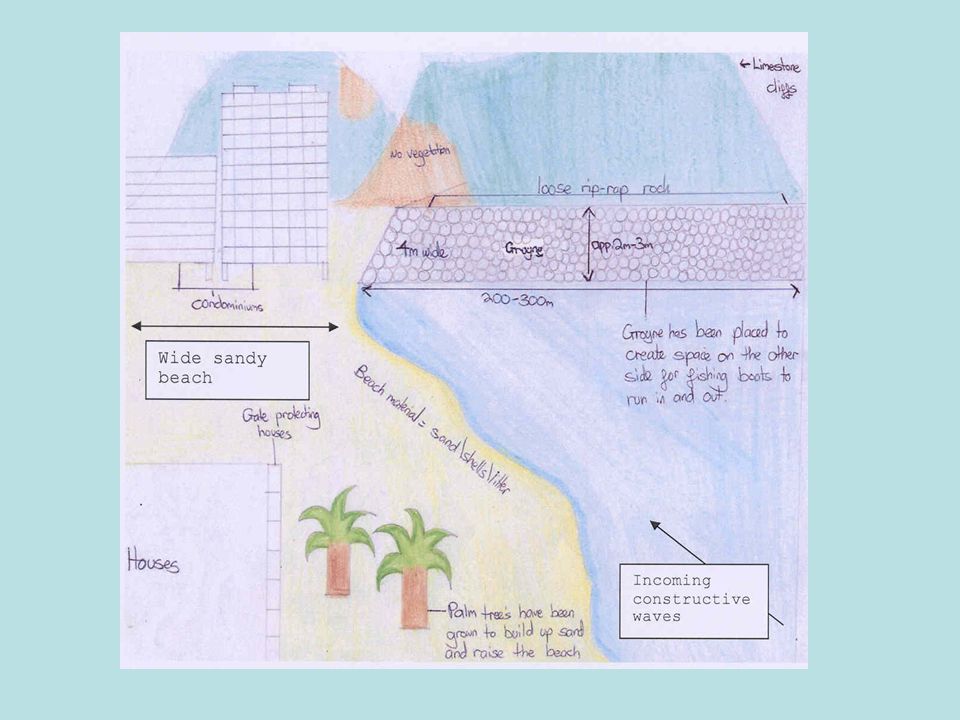
When you arrive at each site you will produce a field sketch. You should aim to: Add annotations. Produce a detailed sketch. Draw it well so you don’t have to waste time reproducing it later. Get the full scope of the beach you are surveying and its surrounding landscape. Take lots of photographs. A good sketch will record all human management in detail

11
To record the wind speed an anemometer will be used. The cups rotate with the wind and are attached to a digital reader. The reading will be taken at head height. Too close to the ground surface would show a lower wind speed. A crude method will be used for wind direction. Throw some light material into the air and use a compass to determine its direction.

12
First reel a tape measure out to measure the width of the beach from where the waves swash breaks on the beach to the backshore (part of beach above high water mark, beyond high water mark). Next place metre rules 5 meters apart (Starting at points 0 to 5 away from the sea). Two people will stand holding the meter rules in an upright position (They act as ranging poles). Next a clinometre will be used to measure the angle of the beach both from points 0 to 5meters and then back down from points 5 to 0. This process will take place between each 5 metre intervals until the whole width of the beach has been measured.
. Two people will stand holding the meter rules in an upright position (They act as ranging poles). Next a clinometre will be used to measure the angle of the beach both from points 0 to 5meters and then back down from points 5 to 0. This process will take place between each 5 metre intervals until the whole width of the beach has been measured..")
13
One person will stand approximately 3 to 4 metres in the sea and drop a dog biscuit into the water. After 3 minutes record the length that the dog biscuit has travelled along the coastline and record the direction it has travelled in. Do this several times to obtain and average.

14
To measure wave height, two people stand knee deep in the sea with one metre rulers holding them vertically and resting them on the sea bed. When a wave approaches one person will measure the crest and one the trough to determine the wave height. This will be repeated 5 times for each site to obtain an average. To calculate wave frequency, stand adjacent to the coast and count the number of waves that break over the period of one minute. Take several recordings and calculate an average.

15
Drop the quadrat randomly along the transect of the width of the beach at approximately metre intervals. The Quadrat has 100 squares to enable an easy calculation of beach material. You should record all material within the quadrat e.g. sand, litter, vegetation etc.

16
Site 1 Name: Time: Date: Climate: Wind Speed: Wind Direction: Width of Beach: Beach Profile:

17
MetresForesightBack sightAverage 0-5 5-10 10-15 15-20 20-25 25-30 30-35 35-40

18
Material0 m10 m20 m30 m40 m Dry sand Wet sand Pollution Sea creatures Vegetation Shingle

19
Wave Height: 12345 Crest Trough Wave Height Average: Long shore drift: Attempt 1: Attempt 2: Average:

20
Divide yourself into 6 groups. Next you should try and think of 3 hypotheses that could be used to test the aim of this project i.e. Has human management affected the coastal processes on this stretch of beach. Look at the data you are collecting. Check with your teacher before writing each hypothesis into your booklets.

Similar presentations


 1. How does a wave form? 2. How do waves change near the shore? 3. How do waves affect.>")


 Investigating an Ecosystem NameTeacher.>")


