Download presentation
Presentation is loading. Please wait.

1
Better Understanding of the Pinellas County Jail Population

2
The three important factors driving the need for higher bed capacity are: 1)the number of inmates is increasing over time 2)the length of stays are increasing over time 3)the number of repeat offenders is increasing over time 4)Other factors for Inmate Population growth is the growth in Pinellas County and mandatory sentencing laws/Policies.
the number of inmates is increasing over time 2)the length of stays are increasing over time 3)the number of repeat offenders is increasing over time 4)Other factors for Inmate Population growth is the growth in Pinellas County and mandatory sentencing laws/Policies.")
3
DEMOGRAPHICS

4
The proportion distribution by demographics has not changed significantly over time, which means there is no one demographic characteristic driving the increase of inmates or length of stays. Although there are the following findings: The largest age group population (18 to 25 Year Olds) is also shows the highest growth (10% a year) Although females are still only a small portion of the inmate population their number (85%) have increase proportionately faster than the males (50%) 77% of the inmate population reside in Pinellas County, Another 12% reside in the three adjacent counties (Hillsborough, Manatee, Pasco). The other 11% reside mostly in the other Florida Counties and in the other U.S. states
 is also shows the highest growth (10% a year) Although females are still only a small portion of the inmate population their number (85%) have increase proportionately faster than the males (50%) 77% of the inmate population reside in Pinellas County, Another 12% reside in the three adjacent counties (Hillsborough, Manatee, Pasco). The other 11% reside mostly in the other Florida Counties and in the other U.S. states.")
5
Average Inmate Population By Gender over Nine Year Period

6
Average Inmate Population By Race over nine year period (1998-2006)
")
7
Age Group By Gender Over Time MALES

8
Age Group By Gender Over Time FEMALE

9
County / Non-County Residents for Inmates Over Time Over time County Residents made up 77% of the Inmate population Pinellas and the three surrounding counties made up 89% of the Inmate Population

10
Across the State of Florida Other is made up the other 47 Florida Counties

11
Across the USA The only state not showing up is New Hampshire These state make up 89% of those USA residents who were arrested in Pinellas County. All other states were less than 1%

12
Average Number of Inmates Per Day

13
Average Inmates per Day Overtime by Gender 1998-2006

14
Average Inmates per Day Overtime by Age Group 1998-2006 352% 114% 16%27% 58% 84% 0%

15
Non-Demographic Indicators

16
Number of Charges The mean number of charges is 1.2 and is consistent overtime, 85% to 87% of the inmate population receive 1 to 2 charges. What has changed overtime is the maximum number of charges has increased from 15 to 99. It is the exception rather than the norm when a person received over 4 charges when arrested.

17
How big is the problem of repeat offenders? Males (47%) are more likely to be a repeat offender than females (39%) African American (57%) are more likely to be a repeat offender than other groups (12%-42%) African American Males whose age is <= 17 at their first arrests (72%) are the most likely to be repeat offenders. The younger you are at your first arrest (63%) the more likely you are to be a repeat offender then other age groups (11%-49%)
 are more likely to be a repeat offender than females (39%) African American (57%) are more likely to be a repeat offender than other groups (12%-42%) African American Males whose age is <= 17 at their first arrests (72%) are the most likely to be repeat offenders. The younger you are at your first arrest (63%) the more likely you are to be a repeat offender then other age groups (11%-49%).")
18
How big is the problem of repeat offenders? Less than half of the individuals (44%) account for up to 77% of the arrests. Approximately 15% offenders are arrested again the following year. Note: It is necessary to look over multiple years to identify a repeat offender
 account for up to 77% of the arrests. Approximately 15% offenders are arrested again the following year. Note: It is necessary to look over multiple years to identify a repeat offender.")
19
Demographics - Repeat Offender

20
Median Number of days to next arrest Repeat offenders show to have a shorter time between release from jail and their next arrests with each additional. For example, at their first arrest, they are incarcerated two days and the median days before their next arrest is 206 days (6-7 months). They repeat this pattern then number of median days before their next arrests decreases, until they are spending more an more days in jail when arrested and less and less days out of jail before being re-arrested. For the 7th arrests the median days incarcerated was 9 and then the median number of day out of jail before being re-arrested was 64 days (2 months).
. They repeat this pattern then number of median days before their next arrests decreases, until they are spending more an more days in jail when arrested and less and less days out of jail before being re-arrested. For the 7th arrests the median days incarcerated was 9 and then the median number of day out of jail before being re-arrested was 64 days (2 months)..")
21
Number of Arrests The breakdown of number of arrests over a nine year period is as follows: 55% have only one arrest 32 % have up to four arrests 13% have up to 5 arrests 5% have up to 7 arrests 4% have up to 13 arrests And 1% have up to 85 arrests Males on average have 2.5 number of arrests while females have 2.2 African Americans are more likely to have more arrests, 3.1 <= 17 year olds are more likely to have more arrests, 3.4

26
Using the Arrest Statutes Literal six types of Crime were created. DrugSexProperty MovingViolentOther How they were defined and created can be found in Appendix B in the Report

31
Other Systems Interaction

36
Average Length of Stay Overtime

50
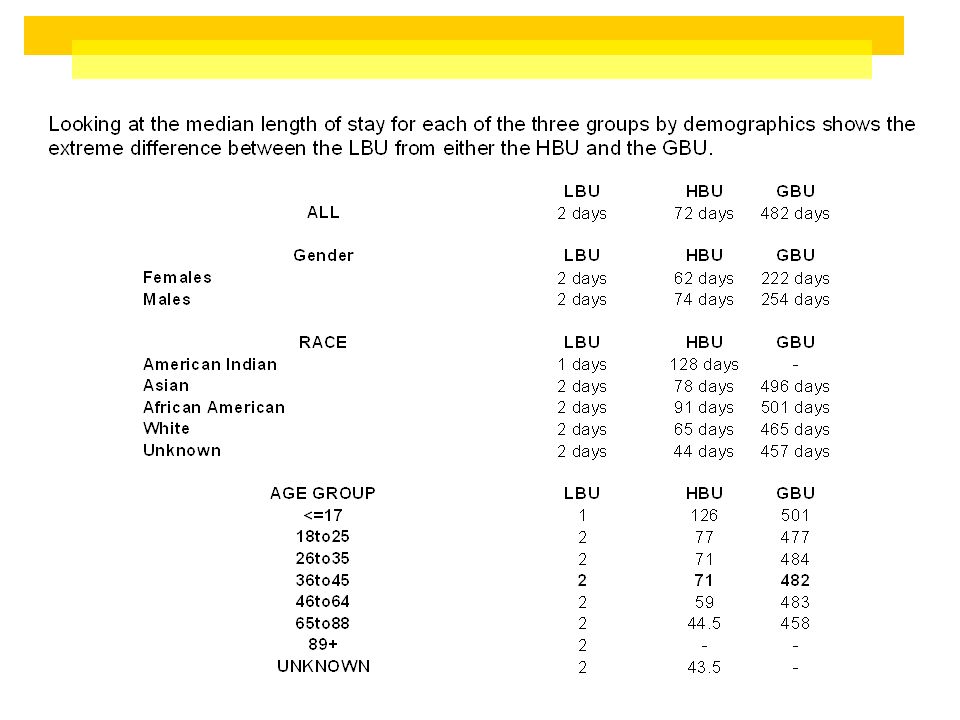
Three groups 1)Low Bed Users (LBU), 2)2) High Bed Users (HBU) 1)and 3) Greatest Bed Users (GBU) 65% of Inmate Population / 3% of Jail Bed Days 5% of Inmate Population / 46% of Jail Bed Days
Low Bed Users (LBU), 2)2) High Bed Users (HBU) 1)and 3) Greatest Bed Users (GBU) 65% of Inmate Population / 3% of Jail Bed Days 5% of Inmate Population / 46% of Jail Bed Days")
53
Table 15. Other Non-demographic Indicators The non-demographic indicators that seem to identify difference between the three groups are Repeat offender, level of crime (Felony/Misdemeanor), Number of arrests, a violation of parole or conditional release. Other factors were DSS interaction, which needs further investigation to understand; number of years in the CJIS system, which really can be explained that the more years in the CJIS system, the more arrests and days incarcerated; and the type of crime also showed a consistent increase across groups.
, Number of arrests, a violation of parole or conditional release. Other factors were DSS interaction, which needs further investigation to understand; number of years in the CJIS system, which really can be explained that the more years in the CJIS system, the more arrests and days incarcerated; and the type of crime also showed a consistent increase across groups..")
56
Geographic Information Systems (GIS) Mapping of Inmate Population using residential zip codes The GIS piece of this paper was done by Luis Perez, a PhD student in Education at USF, as part of his course work requirements. Overall: As stated in the section examining residency status of inmate the majority of the inmate population reside in Pinellas County, and where there is increased residential population density in Pinellas County there is also an increase in the density of residency of the inmate population. In the three surrounding counties there are pockets where 1 to 10 of the Pinellas inmate population resides.

57
BY GENDER: Even remembering that Males are the majority of the Pinellas CJIS inmate population, the zip codes within Pinellas county show to be similar between Males and Females when mapped. However Males within the three adjacent counties are coming from a wider spread geographic area (more zip code areas) than females.
 than females..")
58
BY AGE GROUP: Of all the eight age groups, the youngest (<=17), and oldest (65 to 88) age groups show to reside mainly within the county of Pinellas. This is important information, especially for the youngest age group, because it tells us that if any programs focusing on decreasing the number of <= 17 year olds from interacting with the CJIS system, should work within Pinellas county. The study already showed when the younger you are when you interact with CJIS, the more likely that you will be a repeat offender and potentially become a GBU. The other age groups seem to increase and spread out more across the three adjacent counties as the age increase.

62
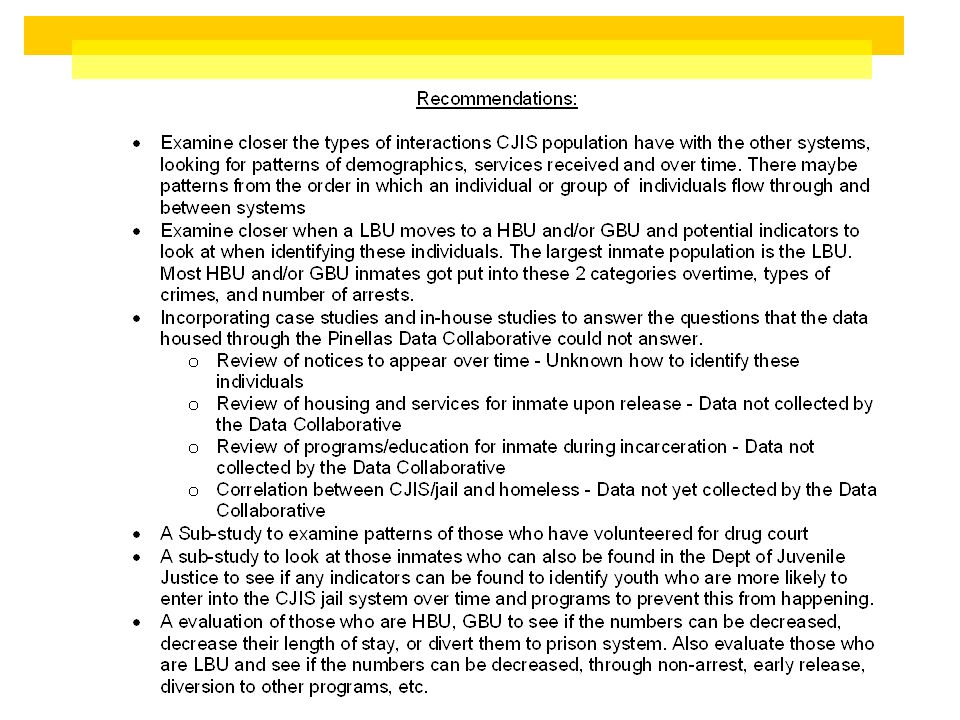
Recommendations Continued….

65
Purposes and Uses of this presentation: This presentation was generated in response to specific questions posed by member of the Pinellas Data Collaborative. It was created to inform administrative policy and program decisions that benefit the citizens of Pinellas County. Before reusing or citing findings in this report, please contact the Data Collaborative to ensure accurate understanding of the analyses and interpretation of results. Questions should be directed to Diane Haynes at dhaynes@fmhi.usf.edu or 813-974-2056.dhaynes@fmhi.usf.edu

Similar presentations


: Treatment and Supervision>")


 Eligible Metropolitan Areas Florida Department of Health HIV/AIDS and Hepatitis Section Division of Disease.>")
 increase crime.>")

 1 DEMOGRAPHY: Population Pyramids December 8, 2014.>")


