Download presentation
Presentation is loading. Please wait.

2
Develop Interpretation Strategy 4 4

3
Objectives Develop Interpretation Strategy -Observe the challenges on the data (data quality, fault complexity, event continuity, etc) -Build strong interpretation framework
 -Build strong interpretation framework")
4
Workflow Develop Interpretation Strategy 1.Scan through the data 2.Start from well and decide what horizon need to interpret to represent what reservoir 3.Build strong interpretation framework through out areas within good data quality and most continuous seismic events 4.Generating seismic attribute cube and Seismic Enhancement if necessary 5.Interpret faults then the horizons 6.Seismic attribute extraction

5
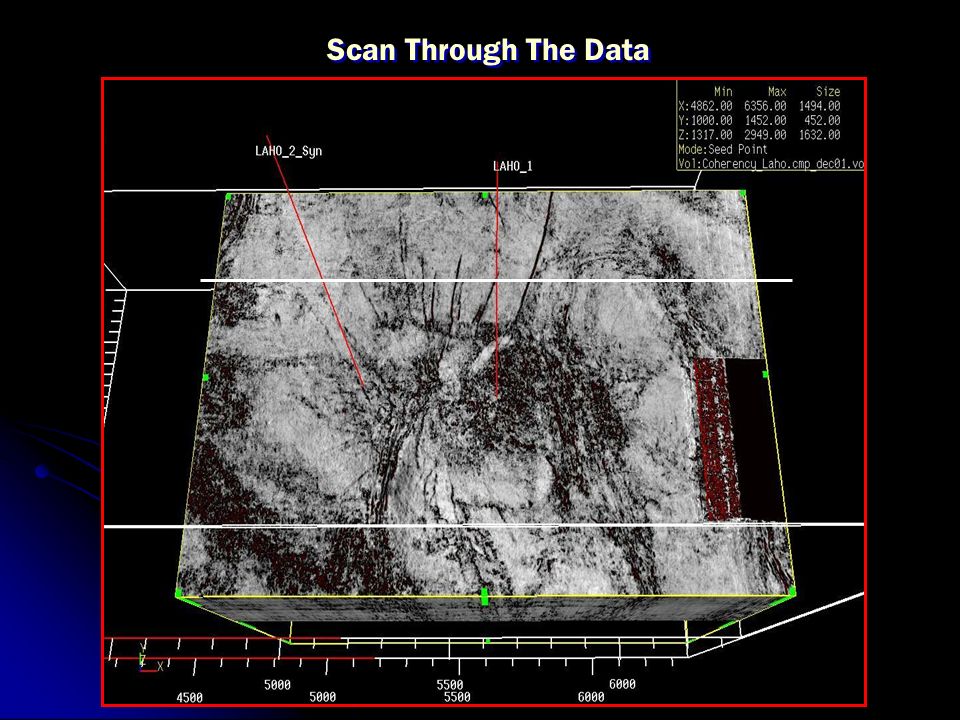
Scan Through The Data

6
5 (data courtesy of KIDRA)
")
7
Scan Through The Data

10
Start Interpretation From The Well

11
Line 90SW-23 Interpreting on 2D Seismic data

12
Improving Seismic Quality Original Data 3-6 Hz filter After Envelope Scaling

13
Improving Seismic Quality

14
Capturing Important Geologic Features

15
FLAT SPOTS Will these also be gas?? Is it water or oil? Possible Gas Sand Tr:482 2 IL :842 Tr:481 9 IL :879 Tr:481 5 IL :931 GAMBIR-1 PROSPECT Capturing Important Geologic Features

16
Improving Seismic Quality Through Multi-Attribute AMPLITUDESWEETNESSAMPLITUDE+SEMBLANCESWEETNESS+SEMBLANCE

17
16 Interpreting Fault

18
17 Difficulty to do fault interpretation onInline Easy to do fault /hor. Interpret. on Random line How important of identifying fault patterns

19
18 Boundary Faults Case 1 of New Workflow In Line Xline Random Line

20
19

21
20 Fault Planes

22
21 Boundary Faults Case 1 of New Workflow

23
22 Complex Faults area Case 2 of New Workflow

24
23 FAULT DELINEATION WORK FLOW EARLIER WORKFLOW Seiswork Even Similarity Prediction (ESP) SeisCube NEW WORKFLOW Seiswork Even Similarity Prediction (ESP) PostStack EarthCube AVI
 SeisCube NEW WORKFLOW Seiswork Even Similarity Prediction (ESP) PostStack EarthCube AVI")
25
24 Advanced workflow for complex fault system Create ESP Cube Poststack ESP Fault Interpretation Seiscube Conventional Seismic Data QC Random Line Book Marks Fun. Faults Edit SeisWorks Workflow 2000 Horizon Auto. Tracking ZAP! Horizon Interpretation Along random line SEISWORK MAPPING

26
25 New Fault Delineation Workflow New Fault Delineation Workflow ESP processing Image Enhancment AGC EC Fault Labeling Cube Math Threshold64-127, min100,max5000000 Voxbody detect Values in range16/32-127 (Volume+128)*1000=Fmax1 (Fmax1+original volume)+Fmax1= Fmax2 Check if any F missing yes no Convert to.3dv Cube Math Voxbody as mask (read to share Mom), *1000=Fmax Remain faults only Reduce unwanted “faults” Make faults in max values Add faults to original data Pick up missing faults Convert to.3dv For interpret Workflow 2001
*1000=Fmax1 (Fmax1+original volume)+Fmax1= Fmax2 Check if any F missing yes no Convert to.3dv Cube Math Voxbody as mask (read to share Mom), *1000=Fmax Remain faults only Reduce unwanted faults Make faults in max values Add faults to original data Pick up missing faults Convert to.3dv For interpret Workflow 2001")
27
26 STEP-1 Generate Event Similarity Prediction (ESP) Cube What is PostStack ESP? PostStack ESP (Event Similarity Prediction) processing provides a set of mathematical tools to assess the similarity of seismic data unbiased by any interpretation. Equation: is a dip shift term M = K= N + w/2 K= N - w/2 G K - H K + K= N + w/2 K= N - w/2 G K + H K +
 processing provides a set of mathematical tools to assess the similarity of seismic data unbiased by any interpretation. Equation: is a dip shift term M = K= N + w/2 K= N - w/2 G K - H K + K= N + w/2 K= N - w/2 G K + H K + .")
28
27 STEP-1 Where ESP used? Fault Delineations Cross SectionMap View

29
28 STEP-1 Where ESP used? Stratigraphic Interpretation Map View Cross Section

30
29 STEP-1 ESP Cube

31
30 STEP-2 Perform ESP Image Enhancement (PostStack) Before Image EnhancementAfter Noise Image Enhancement (FK Fan Filter and AGC)
 Before Image EnhancementAfter Noise Image Enhancement (FK Fan Filter and AGC)")
32
31 STEP-2 ESP Section before noise suppression (in EarthCube)
")
33
32 STEP-2 ESP map view (in EarthCube) Much noise
 Much noise")
34
33 Much noise STEP-2 ESP Section highlighted using Max Opacity (in EarthCube)
")
35
34 Too much “faults” STEP-2 ESP Section after Image Enhancement (in EarthCube)
")
36
35 STEP-3 Faults Parameterization in EarthCube using Automated Voxbody Labeling Amplitudes, Takes the opacity curve Connectivity, Connects the cells Body Size, connect cell volume >XX voxels Rank by Volume, use opacity curve to select bodies by volume

37
36 STEP-3 Automated Fault-body Labeling and generate Cube

38
37 STEP-3 Before and After Fault Body Labeling BeforeAfter

39
38 STEP-4 Cube Math in AVI Faultbody label Cube 1 + Original Seismic Cube

40
39 Some faults missing STEP-4 Original Seismic with fault segments

41
40 STEP-5 Highlight fault segments within low amplitude range

42
41 STEP-6 Perform Cube Math to add new fault label cube to the original seismic data

43
42 Final Seismic Cube with fault traces

44
43 Seismic Section with fault traces

45
44 Fault traces in horizon slice

46
45 3D view of horizon with interpreted fault traces

47
46 New Fault Delineation Workflow New Fault Delineation Workflow ESP processing Image Enhancment AGC EC Fault Labeling Cube Math Threshold64-127, min100,max5000000 Voxbody detect Values in range16/32-127 (Volume+128)*1000=Fmax1 (Fmax1+original volume)+Fmax1= Fmax2 Check if any F missing yes no Convert to.3dv Cube Math Voxbody as mask (read to share Mom), *1000=Fmax Remain faults only Reduce unwanted “faults” Make faults in max values Add faults to original data Pick up missing faults Convert to.3dv For interpret Workflow 2001
*1000=Fmax1 (Fmax1+original volume)+Fmax1= Fmax2 Check if any F missing yes no Convert to.3dv Cube Math Voxbody as mask (read to share Mom), *1000=Fmax Remain faults only Reduce unwanted faults Make faults in max values Add faults to original data Pick up missing faults Convert to.3dv For interpret Workflow 2001")
48
47 Structural Interpretation Structural Interpretation Exclusive Polygon Inclusive Polygon

49
48 Correlation Mode

50
49 Editing Zapped Horizons with Polygon Mode Editing Zapped Horizons with Polygon Mode

51
50 Auto Polygon Generator Auto Polygon Generator

52
51 Horizon Interpretation Workshop Screen 1 Colt Data set Line 62 Start time 500 ms Color bar bluwhtrd

53
52 Horizon Interpretation Workshop Screen 2

54
53 Interpreting a Horizon Show Position Information Bar Horizon Interpretation Information Bar

55
54 Horizon Interpretation Mode Active Horizon Selected but not Active Horizon in defined color

56
55 Interpreting on Time Slices – Auto Tracking Mode Portion of horizon already interpreted

57
56 Zig Zag Display Choose any one of these methods to display the lines: Button 3 Select from Map ZigZag

58
57 Zig Zag Display Seismic View Seismic Select from Map ZigZag

59
58 Zig Zag Display Midpoint Icon, then to Map View Button 3 ZigZag

60
59 Intersection Circles Seismic View Contents Icon Toggle ON Horizon Intersection Circles OK

61
60 ZigZag Display Line 60 Trace 140 Tie Point Line 90 Note the Select from Map icon

62
61 Loop Display Choose any one of these methods to display the lines: Click Button 3, then select Select from Map Loop In the Seismic View, select Seismic Select from Map Loop Click the Midpoint icon, and then in Map View, click Button 3, and select Loop

63
62 Loop Display Button 1 Button 2

64
63 Loop Display Note the Select from Map icon

65
64 Arbitrary Line Display Choose any one of these methods to display the lines: Click Button 3, and select Select from Map Point to Point In Seismic View, select Seismic Select from Map Point to Point Click the Midpoint icon, and then in Map View, click Button 3, and select Point to Point

66
65 Arbitrary Line Display Button 1 Use button 3 to open the popup menu. Select Begin Display

67
66 Arbitrary Line Display

68
67 Seismic Fold and Intersection Displays Seismic fold and intersection displays allow you to choose a tie line to display at any point on the line currently displaying Folds display the intersection of the requested line and the original line Intersections display the entire tie line

69
68 Seismic Fold and Intersection Displays Fold from Seismic Cursor location at Button 1 click Resulting Display Note these instructions

70
69 Seismic Fold and Intersection Displays Intersection from Seismic Resulting Display Place cursor at the desired intersection then press button 1.

71
70 Delta system Interpreting Stratigraphic

72
71 Delta Fan

73
72 Delta Fan

74
73

Similar presentations