Download presentation
Presentation is loading. Please wait.

1
Course 7: utilities and integration

3
Digitize log program

4
Define curve type

5
Wavelet Editor amplitude freq and phase can be edited separately save reference points wihcu

6
Change spectrum to observe influence on wavelet

7
Selecting the required omponend icon allows you to do the editing

8
Batch Manager schedule and run processes later

9
Fill Patterns create your own patterns

10
Previous the pattern you develop

11
Rebuild work area list: creates a new work area.lst file usually created auto when well is imported

12
Project mode control: probably will not use since no standalone keys

13
Log M Integration

14
Switch to project mode: DC Utilities > Project Mode Control (from the drop down list) > Launch Yes to switch
 > Launch Yes to switch")
15
Wells transferred from discovery to logM

16
Click on the file menu in the logM well editor

17
Select buld transfer collowed by > from Discovery to logM workspace

18
Transfer from disc to logM

19
File > Bulk transfer > fr0m Log M Workspace Trnasferred into discovery workspace and associated with UWI and API logs velocity etc can be transferred back to Discovery

20
You can send wells from logM well editor or model builder >

21
Click on well spots

22
On cross section window select well-to well Click on wells then click in blan area to initiate the model builder

23
Change to projected mode

26
Use to immediately generate 2d trace models in the model builder

27
Top of the madison group with many wells note producing wells in highs and lows Need stratigraphic modeling

30
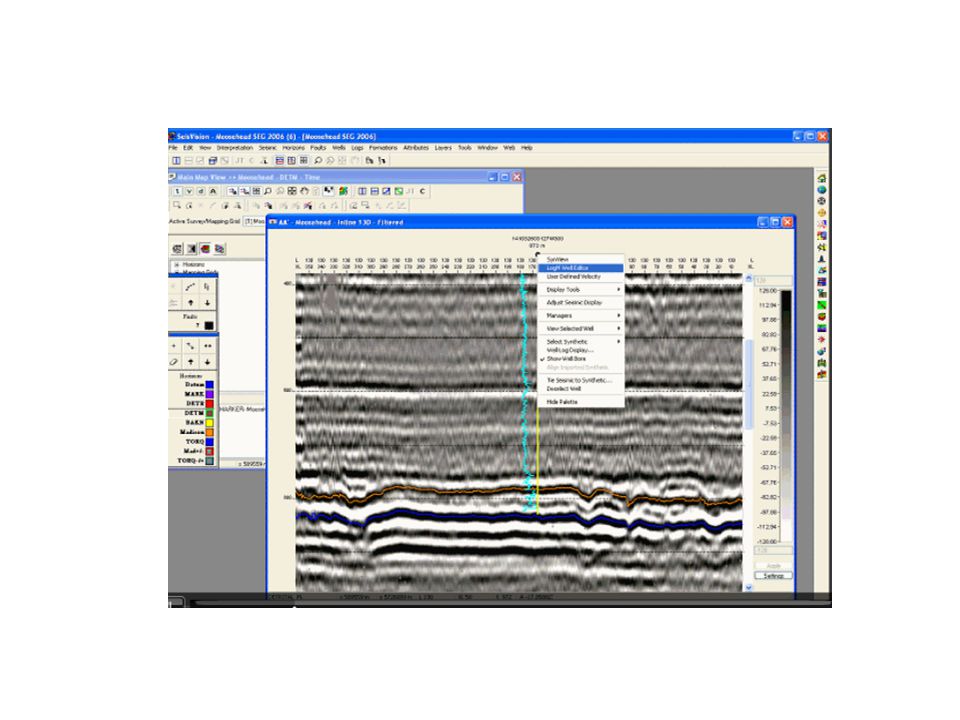
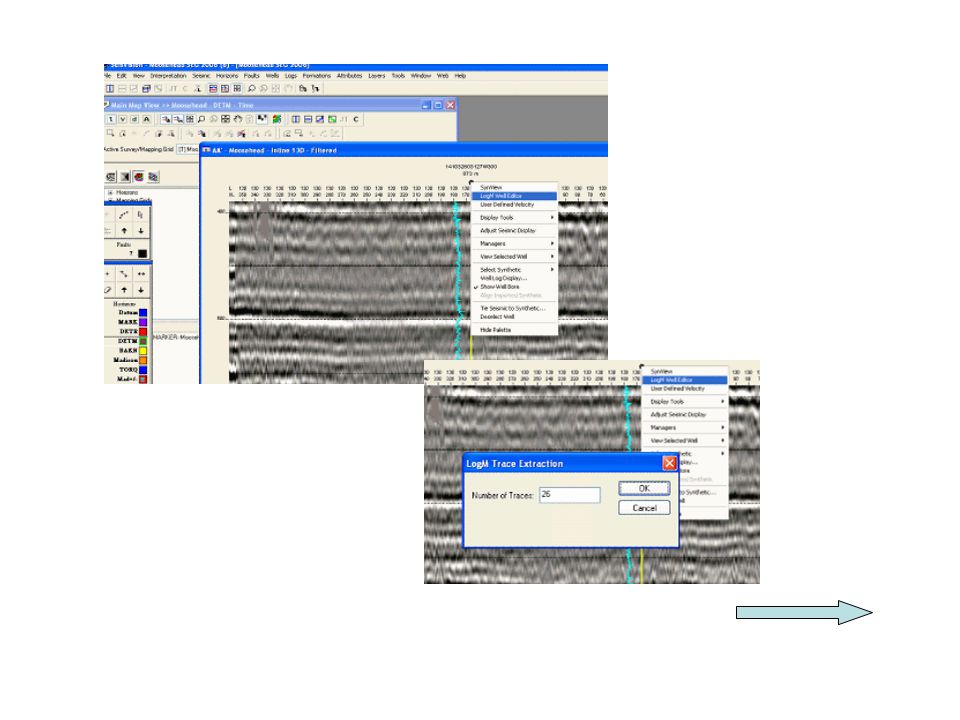
Madison and Torquay horizons picked in seisvision are displayed in the logM Well editor

32
Note the mismatch using logm time alignment, stretch squeeze we can do much better Synthetic is giving a much stronger peak in the Bakken Wavelet phase and freq must match that in the data. We will use the wavelet extraction shaping filter to obtain a much better match

34
Use fluid substitution model Original synthetic

35
Note the presence of slight peak in the synthetic with oil as the pore fluid Next we will examine the influence of water versions of the sonic and density with the extracted wavelet. Note that this peak disappears.

36
Now wel will attempt to quant results with 2D strat modeling

37
wateroilwater

38
We will thicken the oil sand. Launch the middle well in the logm well editor We will use the multicurve stretch squeeze function to thicken the Bakken sand by about 5 meters

39
We can now conclude that both oil (rather than water in the zone) and thickening of the oil zone produce increased amplitude
 and thickening of the oil zone produce increased amplitude")
40
Save back to cross section > auto updated > now out of sync> RMB on traces > regenerate traces

41
Use view model in seisvision we can have the trace model show up in a second vertical trace window

42
We can use the create correlation polygon option from the pop-up menu to overlay the thickened Bakken sand on other various locations on our seismic to attempt to discover other prospective drilling locations

43
Notice the southwest to northeast thickening of the Madison to Torquay interval > open arbitrary line

44
Shows the peak of the Bakken sand over it’s extend across the field >2D models > high am best oil targets

Similar presentations


>")
, 2009 Modified for SDLN Version 20.01 Last Update:>")


 Macro Walkthrough Guide for Excel Version 2003.>")


