Download presentation
Presentation is loading. Please wait.

1
Quality Liaisons November 6th, 2006

2
Responsibilities of the Quality Liaison: Main communication channel between the District and school/department Serve as a "PDSA/Action Research support person for the school or department (to locate resources and/or find answers to questions) Keep the momentum of action research going through discussions, conversations and sharing of information to staff
 Keep the momentum of action research going through discussions, conversations and sharing of information to staff")
3
Purposes of Liaison Network Learn and share best practices in PDSA/Action Research and quality tool usage Network with other liaisons to share ideas and best practices Learn from each other's expertise and experiences and discuss how to deploy and enhance continuous improvement efforts in CRCSD Support the implementation of the 4 Quality Levels at the school

4
Q.L. Lotus – Responsibilities (Define what these mean to you…) Quality Liaison Support Quality Classroom Communication PDSA – Action Research Quality Tools Best Practices Resource (s) Network Staff Development
 Quality Liaison Support Quality Classroom Communication PDSA – Action Research Quality Tools Best Practices Resource (s) Network Staff Development.")
6
Radar Chart Observations What do the results show? What do the results show? Are there common patterns among Quality Liaisons? Are there common patterns among Quality Liaisons?

7
Performing the duties of the Quality Liaison is taking the road less traveled the road less traveledthe road less traveled

8
Learning From Dramatically Improved Schools!

9
40% 50% 60% 70% 80% 90% 100% 91–9292–9393–9494–9595–9696–9797–9898–9999–00 Reading Test Scores - Brazosport ISD African American All Students Hispanic White Economically Disadvantaged 98% 96.6% 93.9% 93.8% 92.3% 82% 70% 64% 60% 50%

10
40% 50% 60% 70% 80% 90% 100% 91–9292–9393–9494–9595–9696–9797–9898–9999–00 Writing Test Scores - Brazosport ISD African American 80% 70% 60% 59% 57% 98% 96.7% 95.6% 94.1% 93.2% Economically Disadvantaged Hispanic White All Students

11
Math - Aldine ISD 93–9494–9595–9696–9797–9898–9999–00 30% 40% 50% 60% 70% 80% 90% 100% African American Whit e 56.2% 49.4% 47.2% 42.2% 55.0% 93.5% 90.9% 89.1% 88.1% 84. 4% Economically Disadvantaged Hispanic All Students

12
What The Successes Have in Common A total systems framework Aligned processes Data-driven decisions Strong leadership A customer focus

13
When school districts apply the principles and techniques of continuous improvement over time, positive and lasting changes in all parts of the system (including student learning) are dramatic.
 are dramatic.")
14
Why Quality and Continuous Improvement? Answer: Its Research Based! Answer: Its Research Based!

15
Whats happening at the next ARDT meeting? Continuing the PDSA Cycle

16
Pre Planning: Identification of Need 1. Develop/Review Student Learning Expectations 2. Examine alignment of learning expectations with assessments 3. Review assessment data 4. Identify areas of need based on assessment Plan: 1. Describe the current process for addressing the identified area of need (flow chart) 2. Review data to determine baseline performance in the specific area identified (Run Chart/Pareto Diagram) 3. Identify potential root causes contributing to the identified area of need (Cause & Effect Diagram, 5 Whys, Relations Diagram) 4. Study research-based best practice/improvement theory addressing areas of need DO 1. Plan for implementation of improvement theory (Force Field Analysis, Action Plan) 2. Implement research-based best practices improvement theory based on root causes according to the Action Plan 3. Monitor the implementation of research-based best practice/improvement theory to insure integrity and fidelity 4. Assess student learning Study: 1. Examine student assessment results (compare to baseline) 2. Assess the impact of research-based best practice/improvement theory on student achievement Act: 1. Standardize the implementation of research- based best practice (improvement theory) that improved student learning (revise the flow chart to reflect changes made to the system) 2. If improvement theory was unsuccessful continue the PDSA cycle (try another improvement theory based on the next identified root causes) Action Research Overview for Professional Learning Communities
 2. Review data to determine baseline performance in the specific area identified (Run Chart/Pareto Diagram) 3. Identify potential root causes contributing to the identified area of need (Cause & Effect Diagram, 5 Whys, Relations Diagram) 4. Study research-based best practice/improvement theory addressing areas of need DO 1. Plan for implementation of improvement theory (Force Field Analysis, Action Plan) 2. Implement research-based best practices improvement theory based on root causes according to the Action Plan 3. Monitor the implementation of research-based best practice/improvement theory to insure integrity and fidelity 4. Assess student learning Study: 1. Examine student assessment results (compare to baseline) 2. Assess the impact of research-based best practice/improvement theory on student achievement Act: 1. Standardize the implementation of research- based best practice (improvement theory) that improved student learning (revise the flow chart to reflect changes made to the system) 2. If improvement theory was unsuccessful continue the PDSA cycle (try another improvement theory based on the next identified root causes) Action Research Overview for Professional Learning Communities.")
17
Identifying Root Cause! 3 Quality Tools –Cause and Effect Diagram –Relations Diagram

19
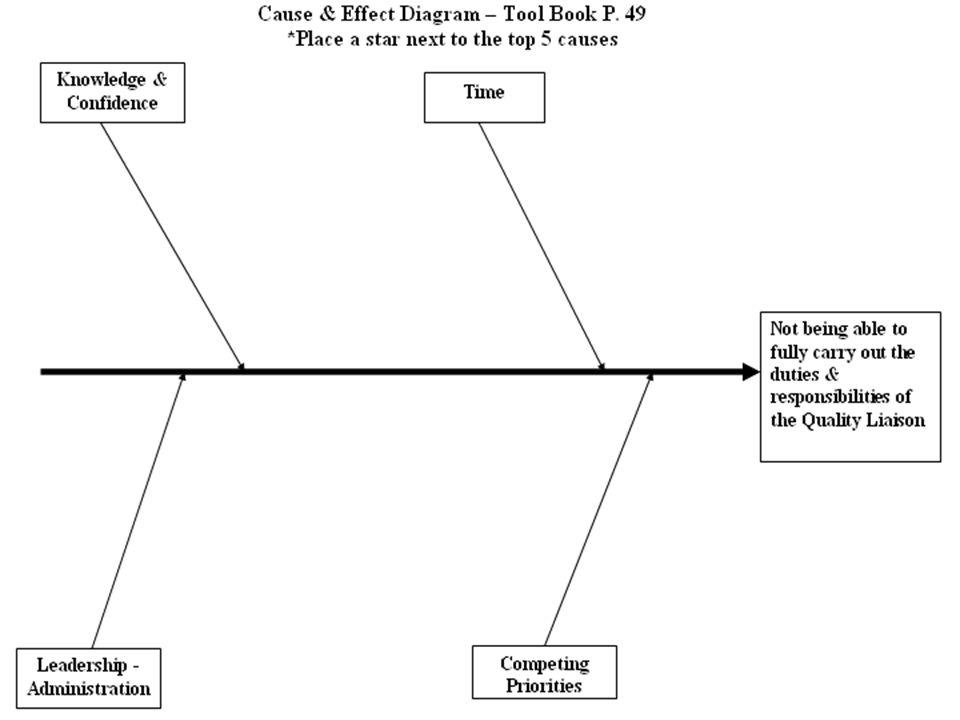
Cause & Effect Diagram How is it made? 1. Identify the problem. 2. Record the problem statement. 3. Draw and label the main bones. 4. Brainstorm for problem causes. 5. Identify the most likely cause candidates.

20
PeopleInstructional Materials State/National Requirements Methodology Low Integration of State Test Objectives Across Curriculum Areas Internal resistance to change Lack of knowledge Lack of information Teachers have no knowledge on how to integrate Time Worksheets & games isolate skills State tests divided by content area Identified Problem (effect) Backbone Primary Causal Categories Cause Sub Cause
 Backbone Primary Causal Categories Cause Sub Cause")
22
Whats Next? After completing the Cause and Effect Diagram, the Relations Diagram can help identify root causes

23
Relations Diagram

24
How is it made? 1. Clearly define the issue or problem. 2. Construct the diagram layout. 3. Analyze the relationships. 4. Count the arrows. 5. Identify the root causes and effects. 6. Study the final diagram.

25
Problems in Physical Education) The Teacher Was Mean Some Students Were Not Listening To The Teacher The Teacher Yelled At Us Some Students Were Not Behaving #In / #Out 2 / 1 3 / 0 0 / 3 1/ 2 Root causes are those factors or aspects of a problem which primarily influence other factors (arrows out)
 The Teacher Was Mean Some Students Were Not Listening To The Teacher The Teacher Yelled At Us Some Students Were Not Behaving #In / #Out 2 / 1 3 / 0 0 / 3 1/ 2 Root causes are those factors or aspects of a problem which primarily influence other factors (arrows out)")
27
Root Cause Identified Once root cause is identified… it is time to select a research-based improvement theory

28
Prior to next meeting… Share the Deployment Instrument with your Building Leadership Team and discuss how it could be used to… Share the Deployment Instrument with your Building Leadership Team and discuss how it could be used to… Provide support to your Action Research Deployment Team Provide support to your Action Research Deployment Team November 29/30 November 29/30 Cause & Effect Cause & Effect Relations Diagram Relations Diagram

29
Final Thoughts… Questions? Questions? Comments? Comments? Meeting Evaluation Meeting Evaluation Next Meeting- January 23 rd, 2007 Next Meeting- January 23 rd, 2007 Thank you- Leaders of Continuous Improvement!

Similar presentations