Download presentation
Presentation is loading. Please wait.

 Find the SIP goal area that matches the Action Research area you work on.")
1
The Continuous Improvement Classroom
4-6-07

2
Please sit by SIP goal area
1.) Find the SIP goal area that matches the Action Research area you work on at school 2.) Only 2 people from each school per table 3.) Each table should have representatives from at least 3 schools
 Find the SIP goal area that matches the Action Research area you work on at school. 2.) Only 2 people from each school per table. 3.) Each table should have representatives from at least 3 schools.")
7
Agenda Sharing: Implementing the 4 Quality Levels
Action Research/PDSA (in the classroom) Wrap-up/Evaluation
 Wrap-up/Evaluation.")
8
The Continuous Improvement Classroom
Ground rules created by students Classroom mission statements Classroom and student measurable goals Quality tools and PDSA used regularly The Continuous Improvement Classroom Classroom data centers Classroom meetings facilitated by students Student-led conferences Student data folders

9
The CRCSD Continuous Improvement Classroom
(Read this first ) Student data folders are used to represent student progress. --> Students maintain their own data folders (or portfolios) and share them with parents during “student led conferences”
 Student data folders are used to represent student progress. --> Students maintain their own data folders (or portfolios) and share them with parents during student led conferences")
10
Expected Outcomes of the continuous improvement classroom
Student ownership, responsibility and accountability for learning Increased academic achievement Customer/student focused Results driven

11
Improvement - 4 Quality Levels
Classroom Continuous Improvement - 4 Quality Levels

12
Earlier today you completed the Continuous Improvement Self-Assessment…
Let’s Reflect!

13
Sharing As you reflect upon your progress with continuous improvement & the 4 Quality Levels… What were your key accomplishments? Success stories? Challenges? What changes did you observe in achievement, attitude and climate? What are your plans to continue implementation? What are your key focus areas for next year?

14
Why Quality and Continuous Improvement?
Answer: The World is Changing

15
The World is Flat Permanent Change!
”The long-term opportunities and challenges that the flattening of the world puts before the United States are profound. Therefore, our ability to get by doing things the way we’ve been doing them…will not suffice any more.” Permanent Change! Thomas Friedman

16
Learning From Dramatically Improved Schools!
What process do they use to improvement their district, schools and classrooms?

17
Reading Test Scores - Brazosport ISD
98% 40% 50% 60% 70% 80% 90% 100% 96.6% 93.9% White 93.8% 92.3% 82% All Students Hispanic African American 70% 64% 60% Economically Disadvantaged 50% 91–92 92–93 93–94 94–95 95–96 96–97 97–98 98–99 99–00

18
Writing Test Scores - Brazosport ISD
98% 40% 50% 60% 70% 80% 90% 100% White 96.7% All Students 95.6% 94.1% 93.2% Hispanic 80% Economically Disadvantaged 70% African American 60% 59% 57% 91–92 92–93 93–94 94–95 95–96 96–97 97–98 98–99 99–00

19
Math - Aldine ISD White Hispanic Students African American
30% 40% 50% 60% 70% 80% 90% 100% 93.5% White 90.9% 89.1% Hispanic 88.1% 84. 4% All Students 56.2% African American 55.0% 49.4% Economically Disadvantaged 47.2% 42.2% 93–94 94–95 95–96 96–97 97–98 98–99 99–00

20
What The Successes Have in Common
A total systems framework Aligned processes Data-driven decisions Strong leadership A customer focus PDSA as “the” improvement process

21
Why Quality and Continuous Improvement?
Answer: It’s Research Based!

22
Sharing PDSA / A.R. Talk about your school’s PDSA/A.R. efforts this year Talk about what’s worked well Talk about areas that your Action Research team has struggled with Data & in-process measures?

23
An overview of PDSA

24
F

25
As a school improvement model
PDSA As a school improvement model

26
After reviewing vocabulary assessment data, teachers discuss options at a team meeting and use the PDSA process They define how they are currently teaching vocabulary (flowcharts) The team determines what other in-process measures they could use to see how students are doing in vocabulary and they collect data (run charts & pareto diagrams) to get baseline The team reviews the baseline data they collected and discuss root causes for the results they see (cause & effect diagrams & relations diagrams) Once root causes are identified, each member researches articles and best practices related to vocabulary instruction and submits the best to the group (improvement theory)
 The team determines what other in-process measures they could use to see how students are doing in vocabulary and they collect data (run charts & pareto diagrams) to get baseline. The team reviews the baseline data they collected and discuss root causes for the results they see (cause & effect diagrams & relations diagrams) Once root causes are identified, each member researches articles and best practices related to vocabulary instruction and submits the best to the group (improvement theory)")
27
Teams continue to use the PDSA cycle to make improvements in the realm of their professional learning community Members reflect, observe, practice, receive feedback, gain expertise and standardize the new vocabulary instruction practice (new flowchart) Members monitor student data to determine effectiveness of strategies (compare to baseline) Members coach each other & may go into each others classroom to observe and provide feedback The team writes an action plan to carry out the improvement theory in their classrooms. Members practice newly-learned strategies (improvement theory), and measure the effectiveness of the strategies
 Members monitor student data to determine effectiveness of strategies (compare to baseline) Members coach each other & may go into each others classroom to observe and provide feedback. The team writes an action plan to carry out the improvement theory in their classrooms. Members practice newly-learned strategies (improvement theory), and measure the effectiveness of the strategies.")
28
From High Stakes Assessment to In-Process Measures
Mistaken Belief: “It’s the adults who use assessment results to make the most important instructional decisions…” Mistaken Belief: “The most important decisions are made annually based on annual high-stakes tests” 18:05-24:27

29
Data Center Examples

30
Getting Everyone Involved in PDSA & Continuous Improvement

31
As a classroom improvement model
PDSA As a classroom improvement model

33
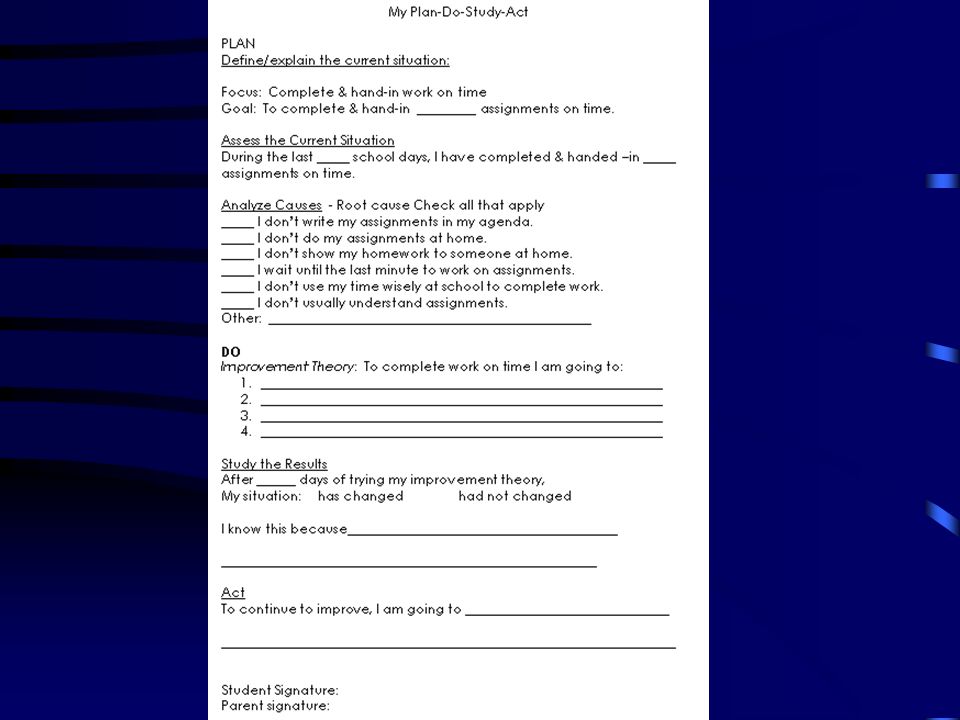
ACT PLAN STUDY DO Plan Continuous Improvement Define the System
Standardize Improvement ACT Assess Current Situation PLAN STUDY Study the Results DO Analyze Causes Try Out Improvement Theory

34
The Problem- Students aren’t waiting to be called on during instruction
Define the System Plan

35
Define the System Flow Chart
I have an idea I raise my hand Did my teacher call my name? no Blurting out! yes Share my idea out loud

36
Let’s collect some data to see how our system is currently operating.
Assess Current Situation Plan

37
Assess the Situation Run Chart- baseline data

38
Let’s figure out what’s causing the problem
Plan Analyze Causes

39
Analyze Causes Force Field Analysis
Driving Forces We have good ideas Sometimes we remember Restraining Forces We get excited We have a lot to say We forget We don’t like to wait

40
Let’s try something different to improve the behavior
Plan Do Try Out Improvement Theory

41
DO Try Out Improvement Theory
IF we try hard to remember to raise our hands, and hang the run chart in a place we can all see to help us remember, THEN, we will remember to raise our hands before we speak instead of talking out.

42
Let’s see how our theory worked. Did we make improvements?
Plan Study Study the Results Do

43
Study the Results Run Chart- Data after trying out our theory

44
If it worked, let’s standardize our improvements.
Plan for Continuous Improvement Standardize Improvement Act Plan Study Do

45
Baseline Data (Before)
After (Results)
")
50
Sharing How could you involve students in the PDSA process in your classroom? What are the “probletunities” that students could help solve? How could data folders and data centers help involve students in PDSA?

51
Continuous Improvement
Across America – Mountain View, CA

52
Next Steps! Spend a few minutes at your table sharing your next steps!
Continue implementing the 4 Quality Levels in your classroom Use the document to plan and guide your efforts Seek out other professional development opportunities and classes to learn more Network with your colleagues (and your Quality Liaison) Spend a few minutes at your table sharing your next steps!
 Spend a few minutes at your table sharing your next steps!")
Similar presentations


 (Your School/Departments SMART Goals Here)>")


