Download presentation
Presentation is loading. Please wait.

1
Topics in Microeconometrics William Greene Department of Economics Stern School of Business

2
Descriptive Statistics and Linear Regression

3
Model Building in Econometrics Parameterizing the model Nonparametric analysis Semiparametric analysis Parametric analysis Sharpness of inferences follows from the strength of the assumptions A Model Relating (Log)Wage to Gender and Experience
Wage to Gender and Experience")
4
Nonparametric Regression Kernel regression of y on x Semiparametric Regression: Least absolute deviations regression of y on x Parametric Regression: Least squares – maximum likelihood – regression of y on x Application: Is there a relationship between investment and capital stock?

5
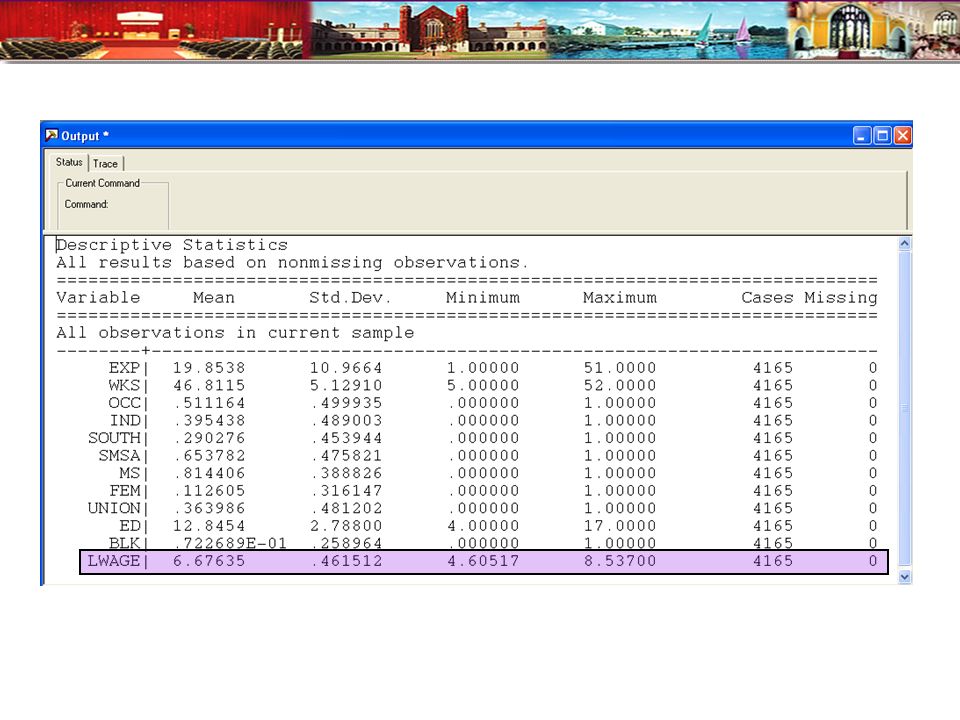
Cornwell and Rupert Panel Data Cornwell and Rupert Returns to Schooling Data, 595 Individuals, 7 Years Variables in the file are EXP = work experience WKS = weeks worked OCC = occupation, 1 if blue collar, IND = 1 if manufacturing industry SOUTH = 1 if resides in south SMSA= 1 if resides in a city (SMSA) MS = 1 if married FEM = 1 if female UNION = 1 if wage set by union contract ED = years of education BLK = 1 if individual is black LWAGE = log of wage = dependent variable in regressions These data were analyzed in Cornwell, C. and Rupert, P., "Efficient Estimation with Panel Data: An Empirical Comparison of Instrumental Variable Estimators," Journal of Applied Econometrics, 3, 1988, pp. 149-155. See Baltagi, page 122 for further analysis. The data were downloaded from the website for Baltagi's text.

6
A First Look at the Data Descriptive Statistics Basic Measures of Location and Dispersion Graphical Devices Histogram Kernel Density Estimator

8
Histogram for LWAGE

9
The kernel density estimator is a histogram (of sorts).
.")
10
Kernel Estimator for LWAGE

11
Kernel Density Estimator

12
Objective: Impact of Education on (log) wage Specification: What is the right model to use to analyze this association? Estimation Inference Analysis

13
Simple Linear Regression LWAGE = 5.8388 + 0.0652*ED

14
Multiple Regression

15
Specification: Quadratic Effect of Experience

16
Partial Effects Education:.05544 Experience:.04062 – 2*.00068*Exp FEM –.37522

17
Model Implication: Effect of Experience and Male vs. Female

18
Hypothesis Test About Coefficients Hypothesis Null: Restriction on β: Rβ – q = 0 Alternative: Not the null Approaches Fitting Criterion: R 2 decrease under the null? Wald: Rb – q close to 0 under the alternative?

19
Hypotheses All Coefficients = 0? R = [ 0 | I ] q = [0] ED Coefficient = 0? R = 0,1,0,0,0,0,0,0,0,0,0,0 q = 0 No Experience effect? R = 0,0,1,0,0,0,0,0,0,0,0,0 0,0,0,1,0,0,0,0,0,0,0,0 q = 0 0
![Hypotheses All Coefficients = 0. R = [ 0 | I ] q = [0] ED Coefficient = 0.](http://images.slideplayer.com/25/7656900/slides/slide_19.jpg "R = 0,1,0,0,0,0,0,0,0,0,0,0 q = 0 No Experience effect. R = 0,0,1,0,0,0,0,0,0,0,0,0 0,0,0,1,0,0,0,0,0,0,0,0 q = 0 0.")
20
Hypothesis Test Statistics

21
Hypothesis: All Coefficients Equal Zero All Coefficients = 0? R = [0 | I] q = [0] R 1 2 =.42645 R 0 2 =.00000 F = 280.7 with [11,4153] Wald = b 2-12 [V 2-12 ] -1 b 2-12 = 3087.83355 Note that Wald = JF = 11(280.7)
.")
22
Hypothesis: Education Effect = 0 ED Coefficient = 0? R = 0,1,0,0,0,0,0,0,0,0,0,0 q = 0 R 1 2 =.42645 R 0 2 =.36355 (not shown) F = 455.396 Wald = (.05544-0) 2 /(.0026) 2 = 455.396 Note F = t 2 and Wald = F For a single hypothesis about 1 coefficient.
 F = Wald = ( ) 2 /(.0026) 2 = Note F = t 2 and Wald = F For a single hypothesis about 1 coefficient..")
23
Hypothesis: Experience Effect = 0 No Experience effect? R = 0,0,1,0,0,0,0,0,0,0,0,0 0,0,0,1,0,0,0,0,0,0,0,0 q = 0 0 R 0 2 =.34101, R 1 2 =.42645 F = 309.33 Wald = 618.601 (W* = 5.99)
.")
24
A Robust Covariance Matrix What does robustness mean? Robust to: Heteroscedasticty Not robust to: Autocorrelation Individual heterogeneity The wrong model specification ‘Robust inference’

25
Robust Covariance Matrix Heteroscedasticity Robust Covariance Matrix

Similar presentations


 Model Instrumental Variables –Fixed Effects Model –Random Effects Model.>")


![[Part 1] 1/15 Discrete Choice Modeling Econometric Methodology Discrete Choice Modeling William Greene Stern School of Business New York University 0Introduction.](/14/4238540/big_thumb.jpg "[Part 1] 1/15 Discrete Choice Modeling Econometric Methodology Discrete Choice Modeling William Greene Stern School of Business New York University 0Introduction.>")

![Part 12: Random Parameters [ 1/46] Econometric Analysis of Panel Data William Greene Department of Economics Stern School of Business.](/16/4906526/big_thumb.jpg "Part 12: Random Parameters [ 1/46] Econometric Analysis of Panel Data William Greene Department of Economics Stern School of Business.>")


 Model –Fixed Effects Model –Random Effects Model –First Difference.>")

![Part 7: Regression Extensions [ 1/59] Econometric Analysis of Panel Data William Greene Department of Economics Stern School of Business.](/16/5264869/big_thumb.jpg "Part 7: Regression Extensions [ 1/59] Econometric Analysis of Panel Data William Greene Department of Economics Stern School of Business.>")


