Download presentation
Presentation is loading. Please wait.

1
Status of Trusted-traveler & Trusted-shipper programs in the Pacific Northwest NC-BSI Workshop Bellevue, WA February 26, 2009 David Davidson, Associate Director, BPRI

2
Cascade Gateway

3
Processing Rate: Cars (SB @ Blaine, WA) Standard laneNEXUS lane 200765 sec.26 sec. What about other RFID-enabled documents (EDL)?
 .")
4
Uptake of RFID-Enabled Documents NEXUS - Canada NEXUS - US EDL - WA

5
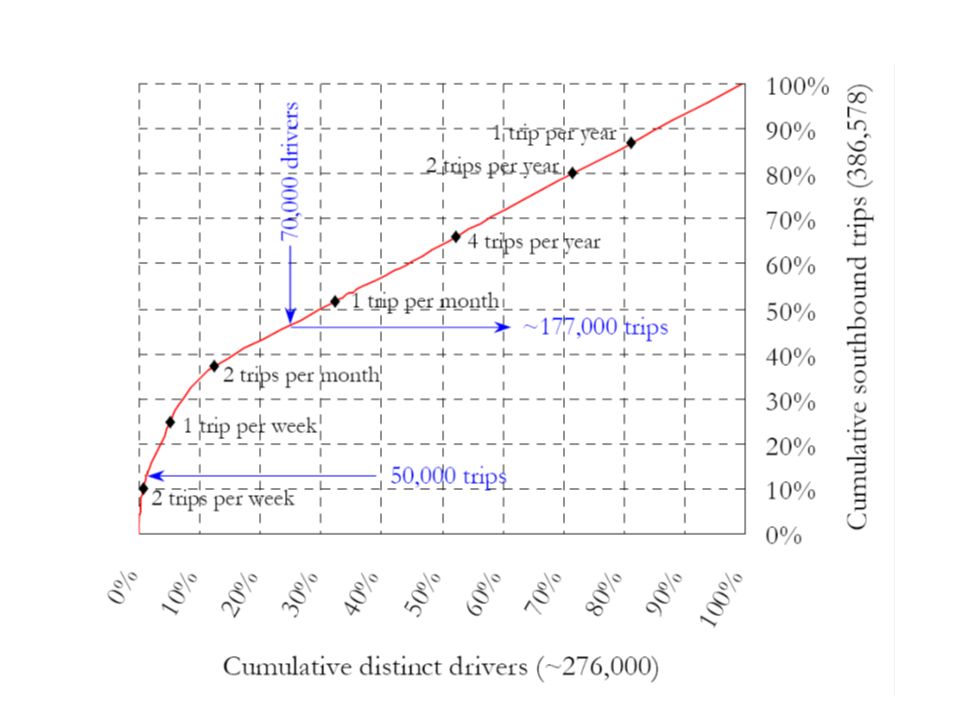
Origin/Destination Survey With Whatcom Council of Governments July 2007 and February 2008 Interviewed 15,000 drivers at four P.O.E.s –Origin & destination & residence –Purpose & duration of trip –Frequency of cross-border travel, in general –Passport?

7
Trip PurposeCanadian ResidentsU.S. Residents weighted #% of totalweighted #% of total Shopping12,63433.4%1,1604.7%928 Recreation8,64122.9%6,32825.9%5842 Vacation8,04721.3%7,59331.1%5149 Family Visit3,1818.4%4,26117.4%4357 Mail1,1513.0%390.2%973 Airport9722.6%7052.9%5842 Church2450.6%5032.1%3367 Doctor/dentist950.3%2821.2%2575 School750.2%3501.4%1882 Subtotal: Discretionary 35,03992.7%21,22187%6238 Work commute1,1773.1%1,0814.4%5248 Business1,5964.2%2,1518.8%4357 Subtotal: Work-related 2,7737.3%3,23213.2%4654 Total37,812100.0%24,453100.0%6139 Who Travels, and Why

8
Canadian ResidentsAmerican Residents

9
NEXUS Summary Best technology for reducing wait-times Target cohort not yet saturated Best market campaign focus: –Near-border (Bellingham, Surrey) –Leisure travelers, not business
 –Leisure travelers, not business")
10
Processing Rate: Trucks (SB @ Pacific Hwy, Blaine, WA) Standard laneFAST lane 200257 sec.- 2006120 sec.87 sec.
 Standard laneFAST lane sec sec.87 sec.")
11
FAST Utilization Rates Detroit – 44 % of shipments Pt. Huron – 31 % Buffalo – 23% Alexandria Bay, Champlain, Ogdensburg – 16 to 20% Blaine – 8% southbound, <5% n.b.

12
Causes: commodity mix DetroitBuffaloBlaine Data source: US Bureau of Transportation Statistics Transborder Surface Freight Database, Oct. 2007, Imports 1—24 25—4041—7172—8182—96 97—99

13
Other Causes: Sophistication of shippers Sophistication of carriers Trip characteristics (1 “turn” vs. 2) Value of goods (delay is not costly)
 Value of goods (delay is not costly).")
14
Upcoming Projects: Border Barometer online tool 2009 Cascade Gateway Commercial Vehicle Operations (CVO) Study
 Study")
15
All reports online: www.wwu.edu/bpri

16
Thank you… David Davidson Associate Director Border Policy Research Institute Western Washington University David.davidson@wwu.edu

Similar presentations

 Balance of International.>")


 Bellingham, WA TBWG Data Workshop Detroit Metro, Michigan Crowne Plaza Hotel,>")


