Download presentation
Presentation is loading. Please wait.

1
Multiple testing Justin Chumbley Laboratory for Social and Neural Systems Research Institute for Empirical Research in Economics University of Zurich With many thanks for slides & images to: FIL Methods group

2
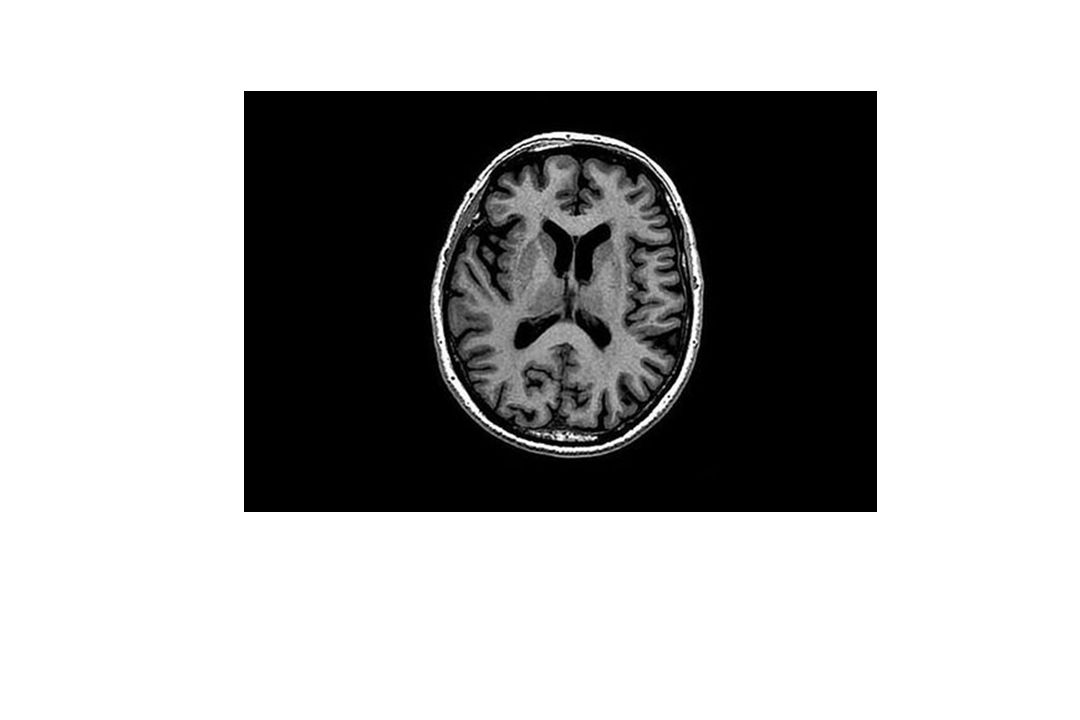
Overview of SPM RealignmentSmoothing Normalisation General linear model Statistical parametric map (SPM) Image time-series Parameter estimates Design matrix Template Kernel Gaussian field theory p <0.05 Statisticalinference
 Image time-series Parameter estimates Design matrix Template Kernel Gaussian field theory p <0.05 Statisticalinference")
3
Inference at a single voxel t = contrast of estimated parameters variance estimate t

4
Inference at a single voxel H 0, H 1 : zero/non-zero activation t = contrast of estimated parameters variance estimate t

5
Inference at a single voxel Decision: H 0, H 1 : zero/non-zero activation t = contrast of estimated parameters variance estimate t h

6
Inference at a single voxel Decision: H 0, H 1 : zero/non-zero activation t = contrast of estimated parameters variance estimate t h

7
Multiple tests t = contrast of estimated parameters variance estimate t h t h h t h What is the problem?

8
Multiple tests t = contrast of estimated parameters variance estimate t h t h h t h

9
Multiple tests t = contrast of estimated parameters variance estimate t h t h h t h Convention: Choose h to limit assuming family-wise H 0

10
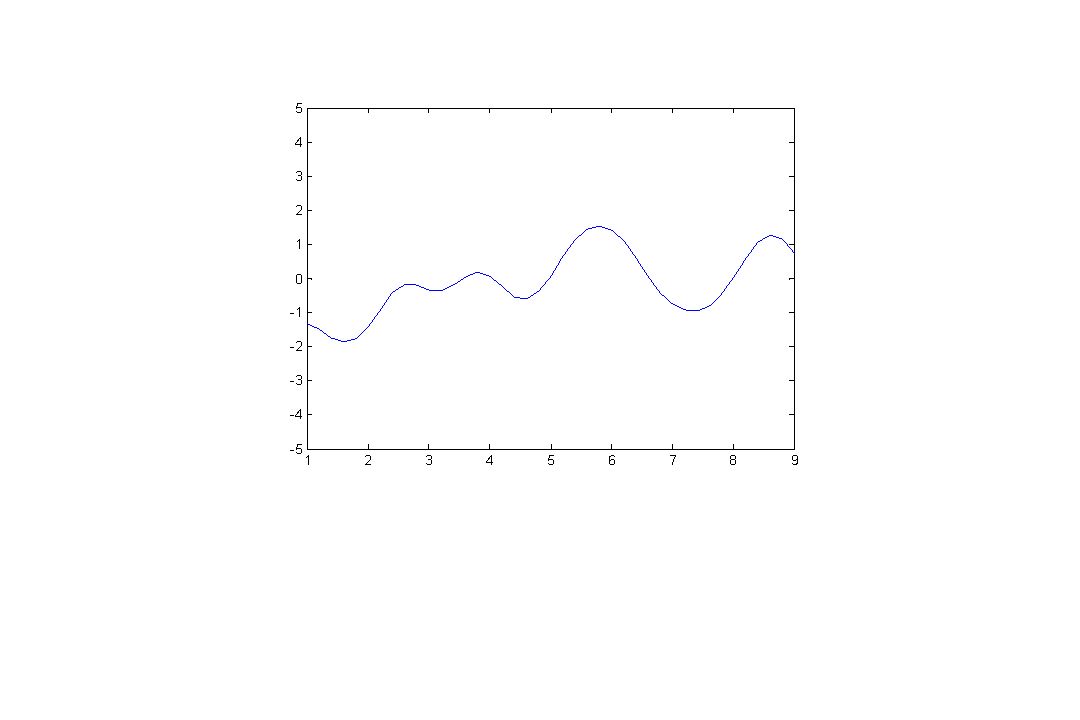
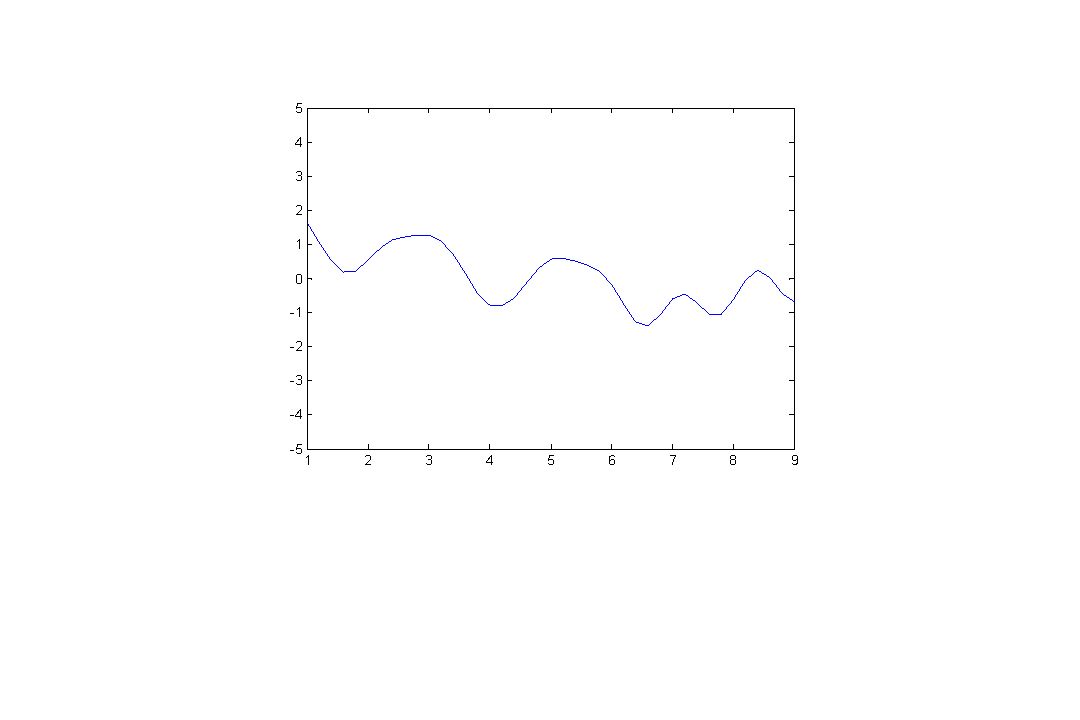
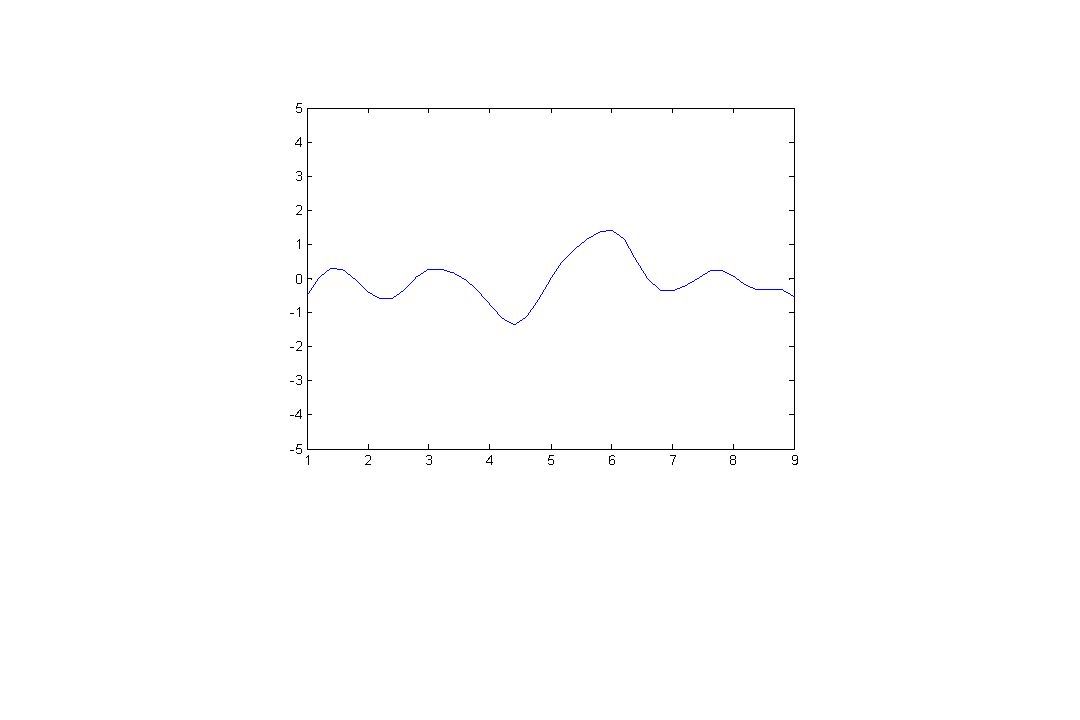
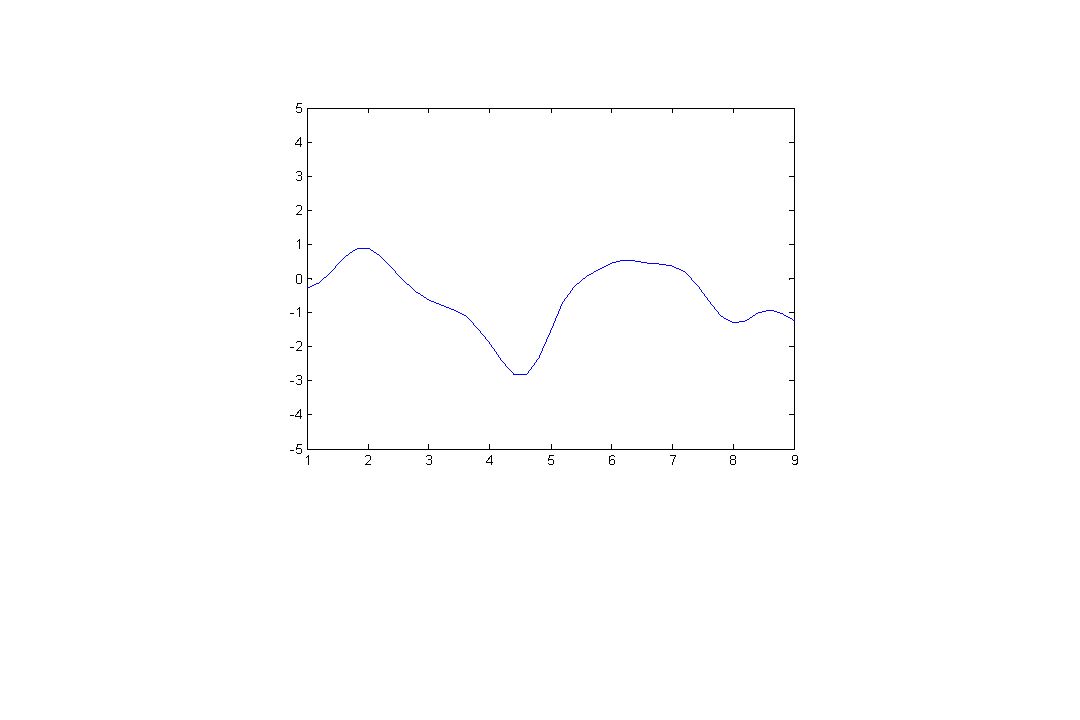
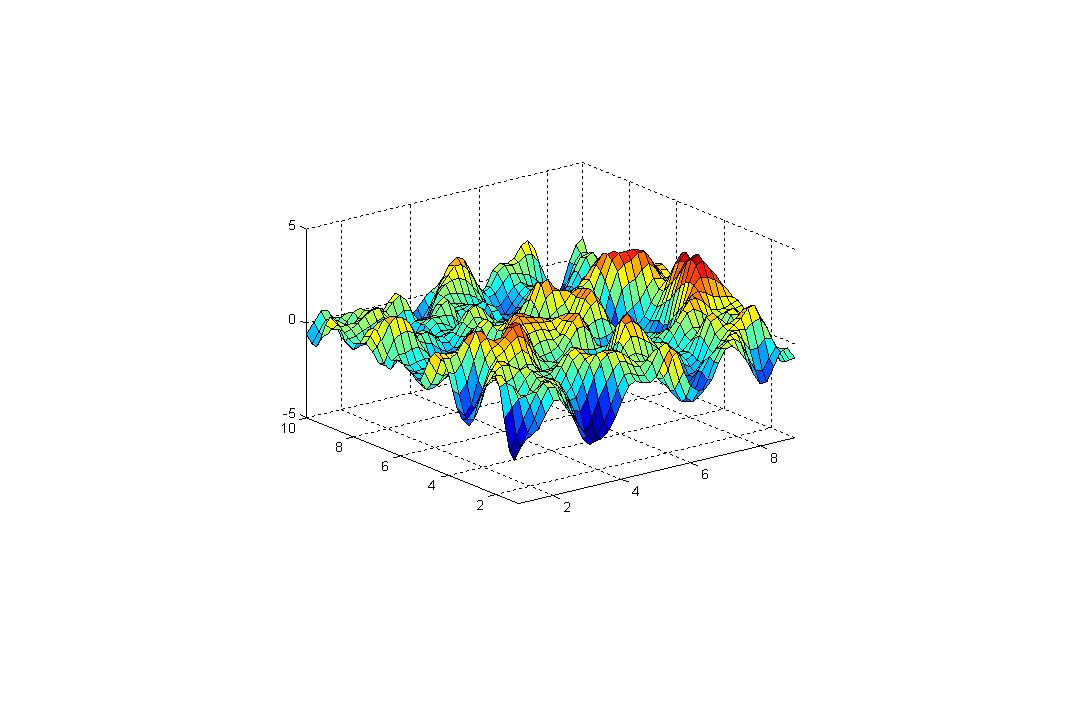
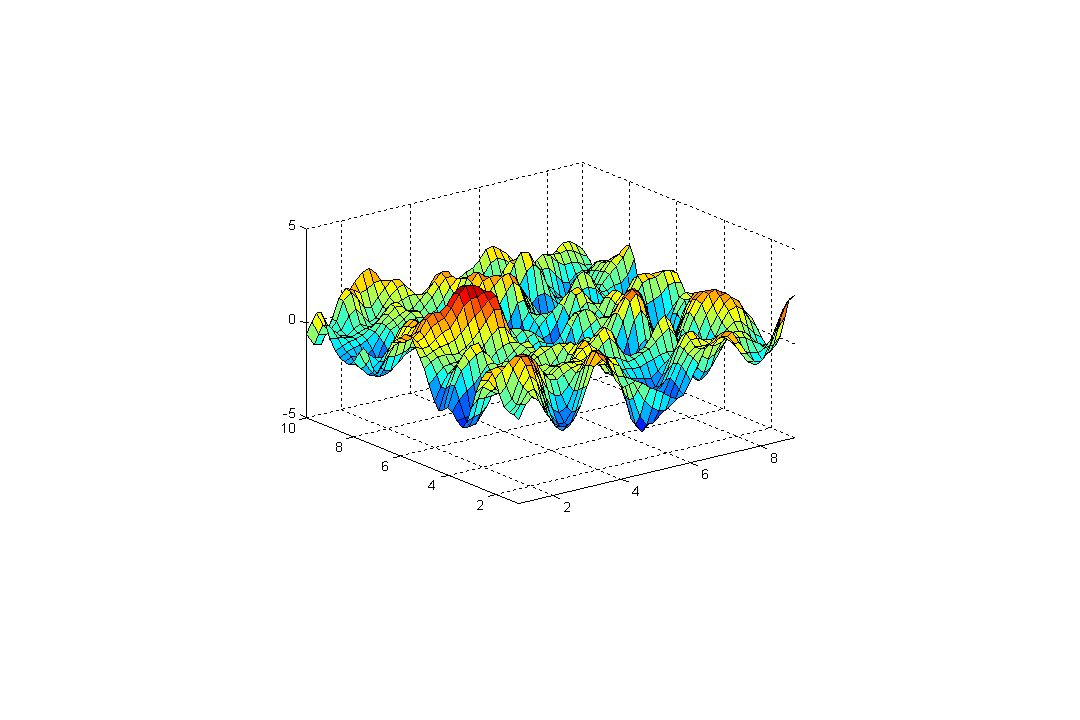
Smooth errors: the facts intrinsic smoothness –MRI signals are aquired in k-space (Fourier space); after projection on anatomical space, signals have continuous support –diffusion of vasodilatory molecules has extended spatial support extrinsic smoothness –resampling during preprocessing –matched filter theorem deliberate additional smoothing to increase SNR Model errors as Gaussian random fields
; after projection on anatomical space, signals have continuous support –diffusion of vasodilatory molecules has extended spatial support extrinsic smoothness –resampling during preprocessing –matched filter theorem deliberate additional smoothing to increase SNR Model errors as Gaussian random fields")
22
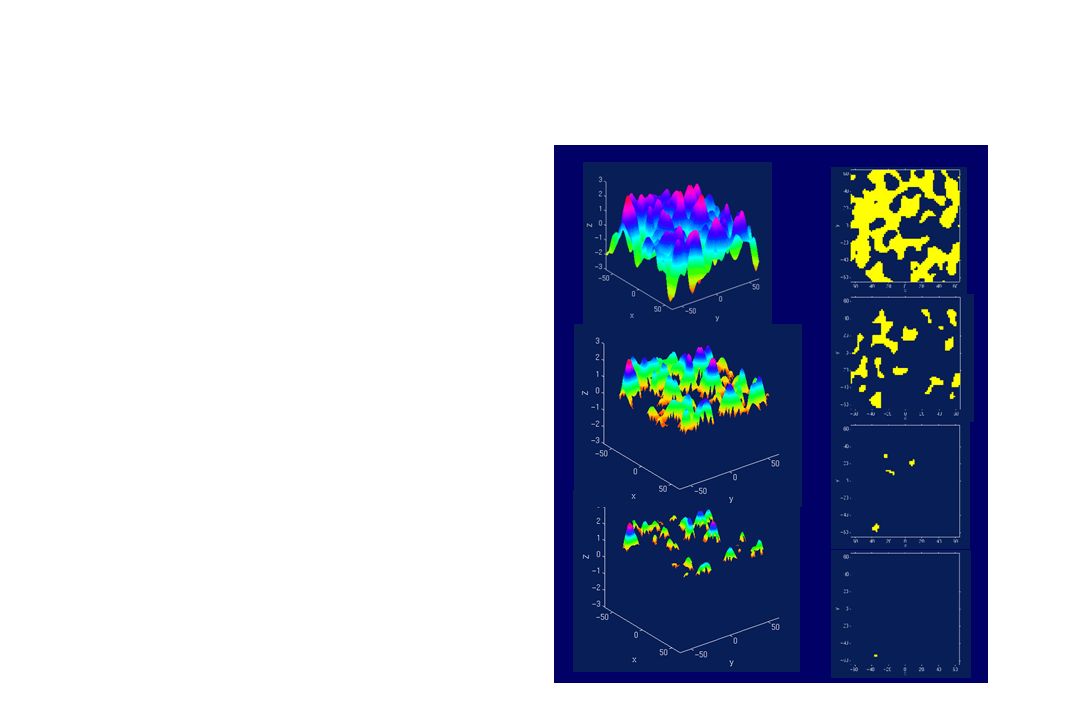
Surprising qualitative features in this landscape?

24
Height Spatial extent Location Total number

25
General form for expected Euler characteristic 2, F, & t fields restricted search regions = R d ( ) d (h) Number of regions, Q? R d ( ): RESEL count; depends on the search region – how big, how smooth, what shape ? d (h): EC density; depends on type of field (eg. Gaussian, t) and the threshold, h. AuAu Worsley et al. (1996), HBM
: RESEL count; depends on the search region – how big, how smooth, what shape . d (h): EC density; depends on type of field (eg. Gaussian, t) and the threshold, h. AuAu Worsley et al. (1996), HBM.")
26
General form for expected Euler characteristic 2, F, & t fields restricted search regions = R d ( ) d (h) Number of regions, Q? R d ( ): RESEL count R 0 ( )= ( ) Euler characteristic of R 1 ( )=resel diameter R 2 ( )=resel surface area R 3 ( )=resel volume d (h):d-dimensional EC density – E.g. Gaussian RF: 0 (h)=1- (u) 1 (h)=(4 ln2) 1/2 exp(-u 2 /2) / (2 ) 2 (h)=(4 ln2) exp(-u 2 /2) / (2 ) 3/2 3 (h)=(4 ln2) 3/2 (u 2 -1) exp(-u 2 /2) / (2 ) 2 4 (h)=(4 ln2) 2 (u 3 -3u) exp(-u 2 /2) / (2 ) 5/2 AuAu Worsley et al. (1996), HBM
: RESEL count R 0 ( )= ( ) Euler characteristic of R 1 ( )=resel diameter R 2 ( )=resel surface area R 3 ( )=resel volume d (h):d-dimensional EC density – E.g. Gaussian RF: 0 (h)=1- (u) 1 (h)=(4 ln2) 1/2 exp(-u 2 /2) / (2 ) 2 (h)=(4 ln2) exp(-u 2 /2) / (2 ) 3/2 3 (h)=(4 ln2) 3/2 (u 2 -1) exp(-u 2 /2) / (2 ) 2 4 (h)=(4 ln2) 2 (u 3 -3u) exp(-u 2 /2) / (2 ) 5/2 AuAu Worsley et al. (1996), HBM.")
27
Space height, h Size of a region, S?

28
Location of events? Space ‘Poisson clumping heuristic’ high maxima locations follow a spatial Poisson process. Number of events: Poisson distributed, under high thresholds (Adler & Hasofer, 1981).
..")
29
Location of events? Space ‘Poisson clumping heuristic’ high maxima locations follow a spatial Poisson process - Thinned Number of events: Poisson distributed, under high thresholds (Adler & Hasofer, 1981).
..")
30
‘F W E’ decisions 1.Induce a set of regions, 2.Ensure Each element of A departure from flat signal

31
F W E Advantage –Adaptive to spatial noise (unlike voxel-wise approaches, voxBonf/voxFDR). Disadvantage –Stingy

32
FDR Consider A … –not a set of positive decisions –a set of candidates, with unknown noise/ signal partition Decide on a partition? –BH algorithm 1.Arranges candidates according to ‘improbability’ 2.Determines a partition

33
FDR Select desired limit on FDR Order p-values, p (1) p (2) ... p (V) Let r be largest i such that i.e. decides on a partition of A controlling JRSS-B (1995) 57:289-300 p(i)p(i) i/ |A| (i/|A|) p-value 01 0 1 i/|A|= proportion of all selected regions
 Let r be largest i such that i.e. decides on a partition of A controlling JRSS-B (1995) 57: p(i)p(i) i/ |A| (i/|A|) p-value i/|A|= proportion of all selected regions.")
34
Conclusions There is a multiple testing problem (From either ‘voxel’ or ‘blob’ perspective) ‘Corrections’ necessary to counterbalance this FWE –Random Field Theory Inference about blobs (peaks, clusters) Excellent for large sample sizes (e.g. single-subject analyses or large group analyses) Afford littles power for group studies with small sample size consider non-parametric methods (not discussed in this talk) FDR represents false positive risk over whole set of regions Height, spatial extent, total number
 Afford littles power for group studies with small sample size consider non-parametric methods (not discussed in this talk) FDR represents false positive risk over whole set of regions Height, spatial extent, total number.")
35
Further reading Friston KJ, Frith CD, Liddle PF, Frackowiak RS. Comparing functional (PET) images: the assessment of significant change. J Cereb Blood Flow Metab. 1991 Jul;11(4):690-9. Genovese CR, Lazar NA, Nichols T. Thresholding of statistical maps in functional neuroimaging using the false discovery rate. Neuroimage. 2002 Apr;15(4):870-8. Worsley KJ Marrett S Neelin P Vandal AC Friston KJ Evans AC. A unified statistical approach for determining significant signals in images of cerebral activation. Human Brain Mapping 1996;4:58-73.
 images: the assessment of significant change. J Cereb Blood Flow Metab Jul;11(4): Genovese CR, Lazar NA, Nichols T. Thresholding of statistical maps in functional neuroimaging using the false discovery rate. Neuroimage Apr;15(4): Worsley KJ Marrett S Neelin P Vandal AC Friston KJ Evans AC. A unified statistical approach for determining significant signals in images of cerebral activation. Human Brain Mapping 1996;4:")
36
Thank you

Similar presentations


>")

>")


>")


