Download presentation
Presentation is loading. Please wait.

1
Prediction of wettability variation and its impact on flow using pore- to reservoir-scale simulations Matthew Jackson, Per Valvatne and Martin Blunt Centre for Petroleum Studies Department of Earth Science and Engineering Imperial College of Science, Technology and Medicine London U.K.

2
Impact of wettability variations Aim of this study is to investigate and predict the effect of wettability variations on flow at the pore- and reservoir-scales Use a pore-scale network model in conjunction with conventional reservoir-scale simulations Predict experimental relative permeability and waterflood recoveries for water-wet and mixed-wet Berea sandstone assuming wettability variations result from variations in S wi Predict the impact on recovery of wettability variations associated with a transition zone above the oil-water contact (variations in S wi )
")
3
The network model: detailed geometry 9mm 3 cube containing 12349 pores and 26146 throats Reconstructed directly from a sample of Berea sandstone —more likely to be truly predictive

4
The network model: detailed physics Two-phase flow in layers and corners Snap-off, piston-type displacement and co-operative pore body filling Allow wettability alteration after drainage by changing advancing contact angle allocated to each oil-filled pore and throat Drainage Waterflooding

5
Prediction of relative permeability: Water-wet Berea data (Oak, 1990) Drainage r = 0°)
 Drainage r = 0°)")
6
Imbibition a = 50-80°) Uniform distribution Prediction of relative permeability: Water-wet Berea data (Oak, 1990)
 Uniform distribution Prediction of relative permeability: Water-wet Berea data (Oak, 1990)")
7
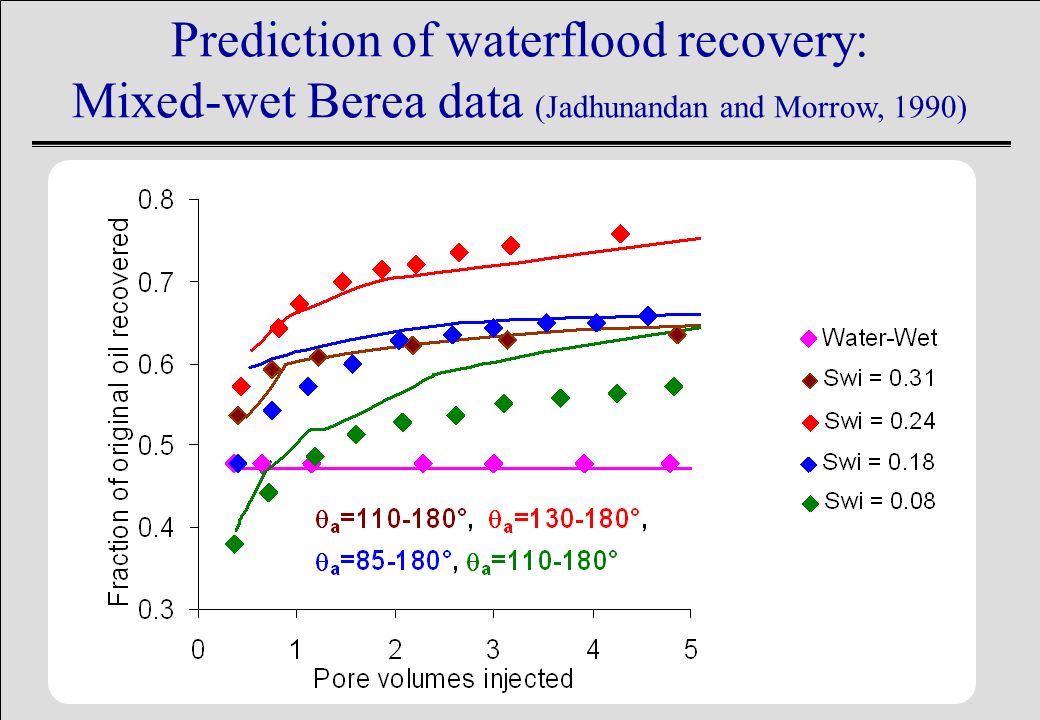
Prediction of waterflood recovery: Mixed-wet Berea data (Jadhunandan and Morrow, 1990)
")
9
Wettability variations above OWC z SwSw More oil wet Water wet Different initial water saturations

10
Hysteresis: Killough model

11
Network model: Water-wet a = 50-80°

12
Network model: Oil-wet a = 110-180°

13
Oil-wet: Killough vs. network Killough model Network model

14
Effect of varying initial water saturation S wi = 0.00 S w = 0.40 S wi = 0.05 S w = 0.40 Pores contacted by oil remain water-wet

15
Effect of varying initial water saturation Pores contacted by oil become oil-wet S wi = 0.00 S w = 0.40 S wi = 0.05 S w = 0.40

16
Hysteresis: Effect at reservoir-scale Use conventional simulation to investigate effect of wettability variations on reservoir-scale flow within transition zone Simulate four cases: — assume reservoir is uniformly water-wet — assume reservoir is uniformly oil-wet — recognise wettability variation — use Killough hysteresis model with oil-wet bounding curve (measured at top of reservoir) — use relative permeability curves derived from network model
 — use relative permeability curves derived from network model")
17
Maureen Field Simulation Model

18
Simulation results

19
Conclusions Predicted experimental relative permeability and waterflood data for water-wet and mixed-wet Berea sandstone Emperical hysteresis models do not capture variations in relative permeability if wettability varies with height due to variations in S wi associated with capillary rise Relative permeabilities predicted by network model reflect pore-scale displacement mechanisms which yield low water relative permeabilities for moderate S wi Wettability variation has a significant effect on predicted recovery at the reservoir-scale Demonstrate that network models of real rocks may be used as a tool to predict wettability variations and their impact on flow at the reservoir- scale

20
Acknowledgements BHP Enterprise Oil Department of Trade and Industry Gaz de France Japan National Oil Corporation PDVSA-Intevep Schlumberger Shell Statoil

Similar presentations