Download presentation
Presentation is loading. Please wait.

1
Is Transit Part of the Equation? Is Transit Part of the Equation? Travel Data Users Forum: How Will the Changing Cost of Energy Affect Personal Travel? Session 681 Wednesday, January 16, 2008, 10:15 AM - 12:00 PM, Hilton Steven E. Polzin, PhD CUTR, USF

2
Comments Historical & theoretical relationship between fuel price and transit use The availability and economics of shifting to transit Data for understanding fuel price and transit use Transit opportunities and challenges

3
Impact of Fuel Prices on Mode Choice Social, Political & Economic Conditions Fuel Price Fuel Supply Mode Choice Transit: Availability Cost Time Auto Travel Cost: Vehicle type Trip length Occupancy Public Attitudes: Climate change Energy Independence Environment

6
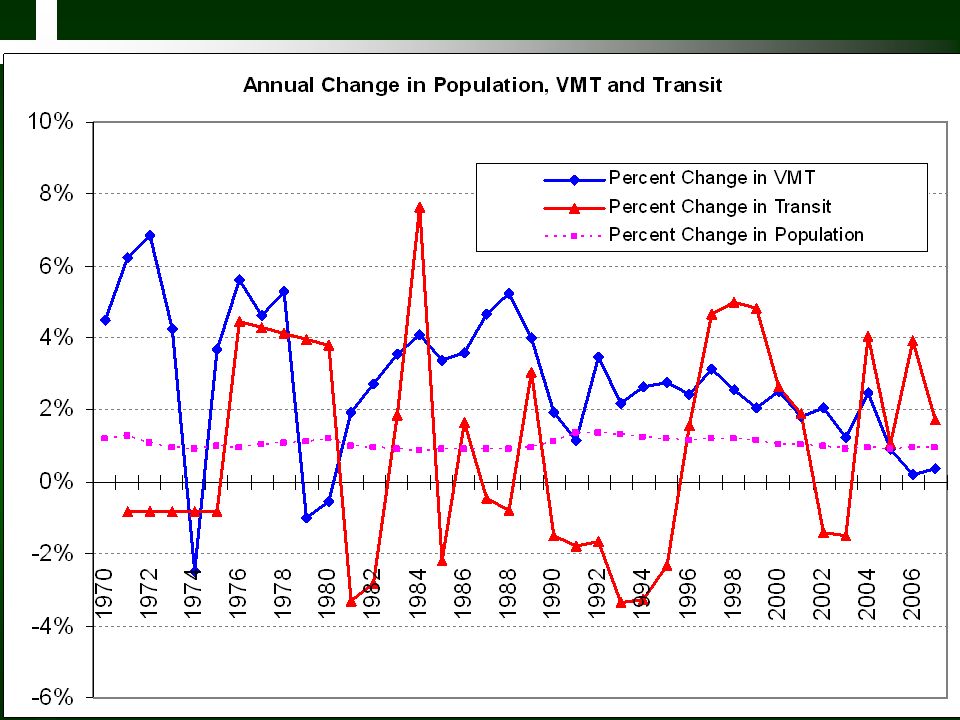
Observations: Research in 2007 established that for every 10% increase in gas prices, US transit demand has increased by around 1.2%, a cross elasticity of demand to gas prices (e) of 0.12 [2]. The same research demonstrated much higher effects on US light rail systems; e= 0.27 to 0.38 (i.e. between two and three times higher than aggregate values) while heavy rail values were e=0.17 and bus was insensitive (e=0.04). These patterns are clearly of much interest to transit planners, however a need for further research has been identified to explore causal patterns further [2]. Understanding Links Between Transit Ridership and Auto Gas Prices – US and Australian Evidence PAPER NUMBER 08-0153 Currie, G. and J. Phung, Transit Ridership, Auto Gas Prices and World Events – New Drivers of Change. Transportation Research Record, Journal of the Transportation Research Board, Washington DC (Forthcomming), 2007.
![Observations: Research in 2007 established that for every 10% increase in gas prices, US transit demand has increased by around 1.2%, a cross elasticity of demand to gas prices (e) of 0.12 [2].](http://images.slideplayer.com/25/7636824/slides/slide_6.jpg "The same research demonstrated much higher effects on US light rail systems; e= 0.27 to 0.38 (i.e. between two and three times higher than aggregate values) while heavy rail values were e=0.17 and bus was insensitive (e=0.04). These patterns are clearly of much interest to transit planners, however a need for further research has been identified to explore causal patterns further [2]. Understanding Links Between Transit Ridership and Auto Gas Prices – US and Australian Evidence PAPER NUMBER Currie, G. and J. Phung, Transit Ridership, Auto Gas Prices and World Events – New Drivers of Change. Transportation Research Record, Journal of the Transportation Research Board, Washington DC (Forthcomming),")
8
8 Almost 50 % of households nationally live within 1/2 mile of a bus route

9
9 Approximately 10 % of the nation’s population lives within one mile of a rail station

10
10 About 50 % of households interviewed in the 1995 NPTS believed they lived within 1/4 mile from a public bus route (2001 NHTS)
")
11
11 About 60% of people work within one-half mile of a bus route

12
12 About 10% of the population works within one-half mile of a rail stop

13
How far can you drive on one “fare’s” worth of Gas?

14
Assuming $3 gas, 20 mpg efficiency, and $1.50 fares, commuters could travel10 miles for the cost of transit Thus 57% of folks would not save out of pocket costs on transit.

15
15 Fleet characteristics and related fuel costs are changing… Base: 2001 NHTS data and 2006 updated fuel costs

16
TRANSPORTATION ENERGY DATA BOOK: EDITION 26–2007 Table 2.13 Energy Intensities of Highway Passenger Modes, 1970–2005 Light trucks not shown.

17
17 Fuel use also varies by trip purpose…. Source: National Household Travel Survey Data Series (NHTS), FHWA
, FHWA.")
18
Challenges of Determining Fuel Price Impacts u Detailed analysis is only possible at local level and then may be impossible due to data/resource constraints. u Extremely difficult to factor out economic, service, fare, marketing, demographic or other confounding factors.

19
What Additional Data Would Help u Aggregate transit use data is old u APC data can provide more specific trip length data for analysis u A basis for normalizing to adjust for local fuel costs, population growth, service supply, fare levels, economic activity, etc.

20
Can Transit Secure an Efficiency Advantage? u New CAFE standards u Improving transit efficiency u Vehicle technology and fuel (vehicle life cycle) u Service speed u Service productivity u Matching vehicle/mode to market u Disciplining the provision of amenities
 u Service speed u Service productivity u Matching vehicle/mode to market u Disciplining the provision of amenities.")
21
21 One last thing…How long will it take for standards on new vehicles to make an impact? The average vehicle is now nearly 9 years old Source: NHTS Data Series, 1977 - 2001

22
22 15 EPA MPGFord Explorer 23 EPA MPG Toyota Camry 26 with 2 Occ. Escalade 48 EPA MPGToyota Prius 2005 NTD data

23
23 Competition Will Change

24
24 Transit Must Be Faster CUTR analysis of 2001 NPTS data

25
25 Source: NTD Data, CUTR Analysis

26
26 Source: NTD Data, CUTR Analysis

27
27 Source: NTD Data, CUTR Analysis Passenger Miles Per Revenue Vehicle Mile

28
How Might Transit Deploy Resources to Respond to a Serious Price Increase or Shortage? u Deploy to longer/faster trips u Implement priority treatments u Build reserve fleets

29
29 Thank You

Similar presentations

 © Prof. K. Zografos STEPs STEPs Scenarios for the.>")


>")


