Download presentation
Presentation is loading. Please wait.

1
After the Storm Peter J. Boulay State Climatology Office DNR- Ecological and Water Resources Grand Marais Flooding- June 2008 (Courtesy Cook County News-Herald)
.")
2
What happens to precipitation (records)? MNgage (Minnesota-area Volunteer Climate Observing Program) MNgage (Minnesota-area Volunteer Climate Observing Program) Statewide density is about one gauge for every 72 square miles (NWS is 625 square miles) Cook County is 134 sq/mi Statewide density is about one gauge for every 72 square miles (NWS is 625 square miles) Cook County is 134 sq/mi Statewide there are 1,411 observers Statewide there are 1,411 observers 25 in Cook County (21 in SWCD) 4 SWCD volunteers in 1990. 25 in Cook County (21 in SWCD) 4 SWCD volunteers in 1990.
 MNgage (Minnesota-area Volunteer Climate Observing Program) Statewide density is about one gauge for every 72 square miles (NWS is 625 square miles) Cook County is 134 sq/mi Statewide density is about one gauge for every 72 square miles (NWS is 625 square miles) Cook County is 134 sq/mi Statewide there are 1,411 observers Statewide there are 1,411 observers 25 in Cook County (21 in SWCD) 4 SWCD volunteers in in Cook County (21 in SWCD) 4 SWCD volunteers in")
3
MNgage is a “Network of Networks” SWCD (Soil and Water Conservation Districts) SWCD (Soil and Water Conservation Districts) National Weather Service Cooperative Observers National Weather Service Cooperative Observers “Backyard” Metropolitan Observers “Backyard” Metropolitan Observers Metropolitan Mosquito Control District Metropolitan Mosquito Control District Department of Natural Resources Forestry Department of Natural Resources Forestry Other Networks (FFA, Deep Portage,Sewer) Other Networks (FFA, Deep Portage,Sewer)
 SWCD (Soil and Water Conservation Districts) National Weather Service Cooperative Observers National Weather Service Cooperative Observers Backyard Metropolitan Observers Backyard Metropolitan Observers Metropolitan Mosquito Control District Metropolitan Mosquito Control District Department of Natural Resources Forestry Department of Natural Resources Forestry Other Networks (FFA, Deep Portage,Sewer) Other Networks (FFA, Deep Portage,Sewer)")
4
Average spacing of NWS stations is 30 miles by design.

5
Design spacing for SWCD gages is ‘every other township’ (12 miles) or better.
 or better.")
7
History of MNgage The early organizers of the network attracted media attention using oversized rain gauges.

8
Data Gathering Methods and Retrieval Interested individuals and agencies Interested individuals and agencies Rain gauges and forms Rain gauges and forms On-line data entry and retrieval On-line data entry and retrieval Annual feedback letter Annual feedback letter Annual quality control Annual quality control Employee of the Month

9
A Successful Network Interested individuals and agencies

10
Equipment Most observers use 4-inch plastic gauges

11
Equipment Observer form

12
Precipitation data is entered on- line Data entry

13
State Climatology Office web site: climate.umn.edu See all your data back in time…

14
Annual Quality Control

15
Benefits and uses Storm water runoff Storm water runoff In depth climate investigations In depth climate investigations Flash flood climatology Flash flood climatology Annual and special summaries Annual and special summaries

16
Data is used by a wide range of clients Federal/state/local agencies Federal/state/local agencies Wetland delineators Wetland delineators Lawyers Lawyers Media Media Schools Schools Engineering firms Engineering firms Weather hobbyists Weather hobbyists Consulting firms Farmers Insurance agencies General public Red Cross Construction companies

17
In Depth Climate Investigations This map shows the amount of precipitation in 2013.

18
Departure From Normal 2013 Cook County was near normal to 6 inches above normal for the year

19
Precipitation Rank in 2013 Southern Cook County was in the 95 th percentile for precipitation for 2013.

20
North Shore Storm of July 18 th, 2013 Highway 61 was closed for a time south of Grand Marias.

21
Parts of Cook County received a month’s worth of rainfall in one day. North Shore Storm of July 18 th, 2013

22
I took this moment to drive from Grand Marais to Lutsen. North Shore Storm of July 18 th, 2013 (courtesy Cook County News Herald)
.")
23
Climate Change

24
In 5 minutes or less…

25
Climate Change: Northeast MN Winter Temperature Increase of four Degrees per Century. (courtesy climate at a glance: NCDC)
.")
26
Climate Change: Northeast MN Winter Temperature Increase of four Degrees per Century. (courtesy climate at a glance: NCDC) 3 rd coldest Winter in 120 Years!
 3 rd coldest Winter in 120 Years!.")
27
“Local” Climate Change Grand Marais 1894 (courtesy Minnesota Historical Society)
")
28
“Local” Climate Change Grand Marais 1915 (courtesy Minnesota State Climate Office)
")
29
Grand Marias Today (courtesy US Army Corps) Anything Different?
 Anything Different")
30
Downtown Grand Marias 2002 (courtesy U of M ) More Changes
 More Changes")
31
Persistent trough pattern keeping MN cool

32
What about the future?

36
Next Winter Temperature?

37
Next Winter Precipitation?

38
Any Questions?

Similar presentations
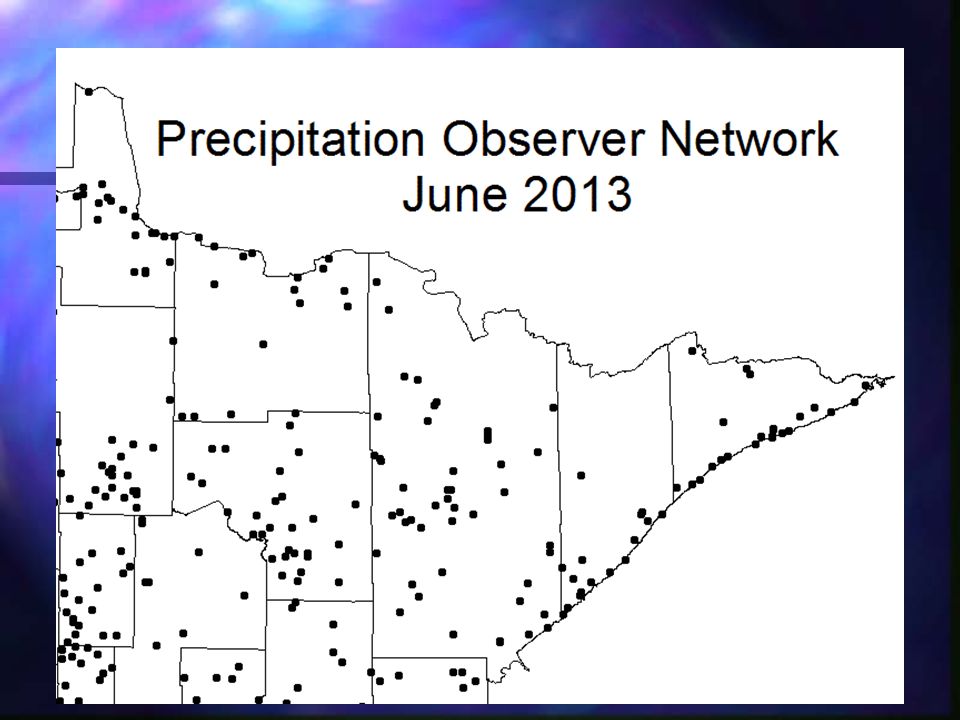
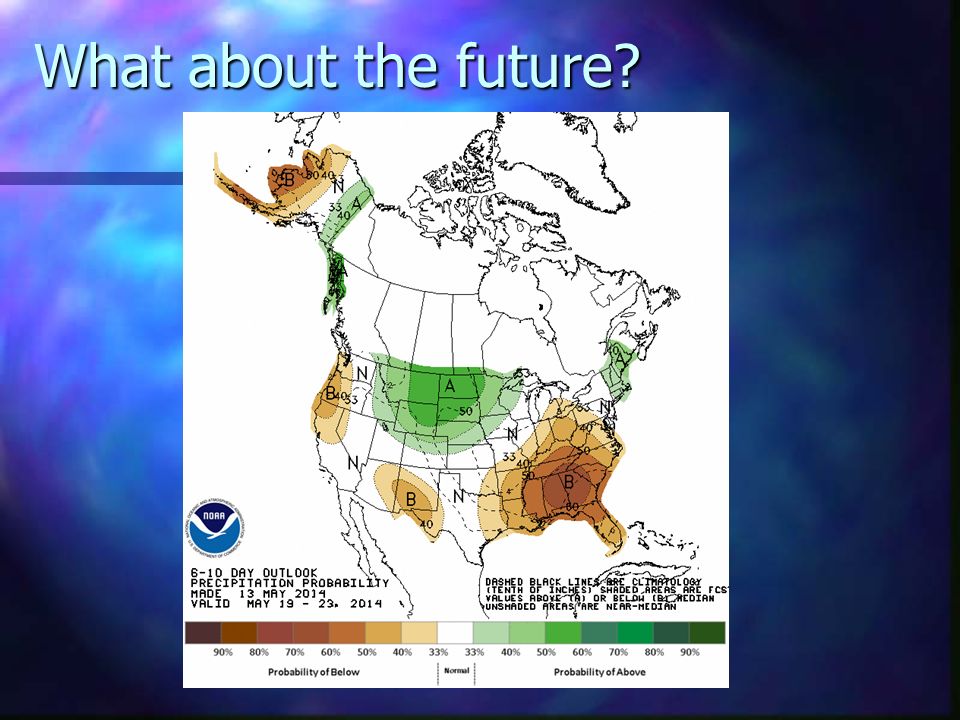
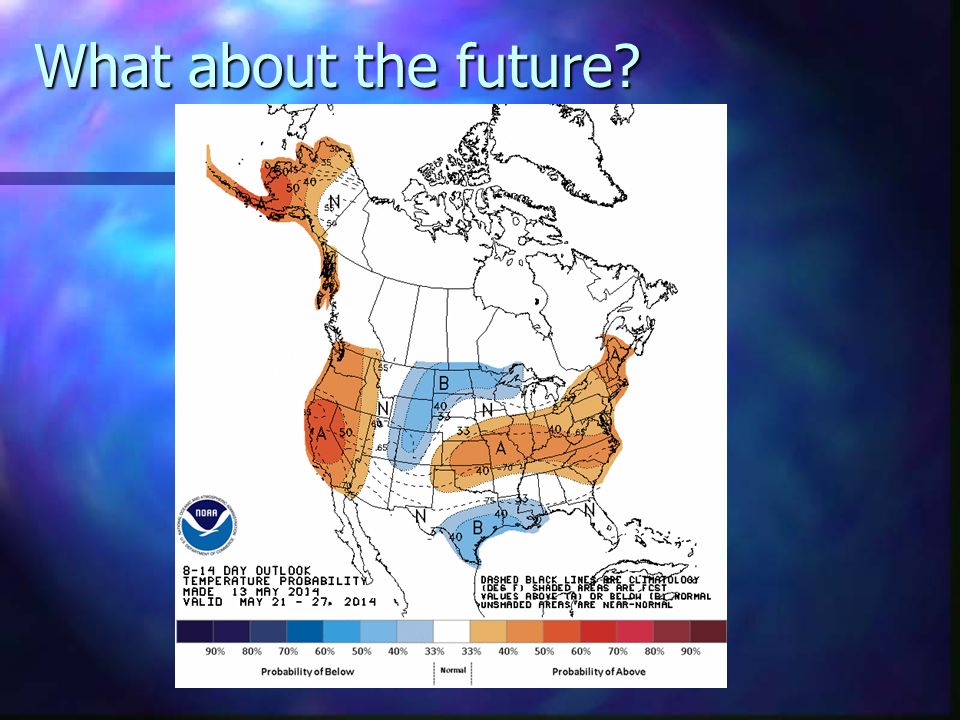


 Figure 7.1 13 14 15 16 17 18 19 20 1970197519801985199019952000 July Temperature.>")


