Download presentation
Presentation is loading. Please wait.

1
Climate Variability and Irrigation Water Use Joel O. Paz Extension Agrometeorologist Biological and Agricultural Engineering Department The University of Georgia Griffin, GA SWGA Water Summit XIV June 17, 2008 Albany, GA

2
Climate Variability 2-3 months Inter-annual Decadal Climate Change Several decades 50+ years Centuries

3
Changing Ocean Temperature Impacts our climate here in the U.S. and across the globe Image courtesy of NOAA Earth Science Laboratory

4
El Niño is one phase of an oscillation in ocean temperatures and atmospheric pressure in the eastern Pacific Ocean that can steer weather systems in the southeastern US and elsewhere. El Niño is considered the warm phase of the oscillation. La Niña (sometimes known as El Viejo) is the opposite atmospheric pattern from El Niño. El Niño-Southern Oscillation (ENSO)
 is the opposite atmospheric pattern from El Niño. El Niño-Southern Oscillation (ENSO).")
5
El Niño is one phase of an oscillation in ocean temperatures and atmospheric pressure in the eastern Pacific Ocean that can steer weather systems in the southeastern US and elsewhere. El Niño is considered the warm phase of the oscillation. La Niña (sometimes known as El Viejo) is the opposite atmospheric pattern from El Niño. El Niño-Southern Oscillation (ENSO)
 is the opposite atmospheric pattern from El Niño. El Niño-Southern Oscillation (ENSO).")
6
SST and Drought Modeling work has now attributed the major North American droughts of the last century-and-a-half to global circulation anomalies forced by tropical SSTs with the tropical oceans playing an important, and probably dominant role. Bulletin of the American Meteorological Society (BAMS), October 2007
, October")
7
SST since 1950 El Niño La Niña neutral

8
ENSO Impacts in the Southeast La Niña Dry Fall, Winter, and Spring Greatly increases Atlantic hurricanes Increases tornadoes in the deep south Greatly increases wildfire risks EL Niño Very wet winter and spring Greatly reduces Atlantic hurricanes Decreases tornadoes in the tornado alley Neutral ENSO phase increases the risk of severe freezes by 3:1 odds.

9
Southeast Climate Consortium Members National Oceanic-Atmospheric Administration USDA Risk Management Agency USDA Cooperative State Research, Extension and Education Service Funding Support

10
Southeast Climate Consortium Mission: To use advances in climate sciences, including improved capabilities to forecast seasonal climate, to provide scientifically sound information and decision support tools for agriculture, forestry, and water resources management in the Southeastern USA.

11
Management Decisions Variety selection Planting dates Acreage allocation Amount and type of crop insurance Marketing Purchase inputs

12
Analysis of Historical Weather Data Year: 123456789101112131415…16

13
Analysis of Historical Weather Data Year: 1234567891011 Neutral 12131415 El Niño La Niña …16

14
Neutral El Niño La Niña Location Shift La Niña El Niño

15
Regional Crop Yield Map

16
Climate Information and Crop Simulation

17
Application: Crop Simulation Historical weather data ENSO Phases Planting dates Soil types Select AL, FL, GA counties Crop Simulation Models Yield Total amount of irrigation No. of irrigation events

18
Average cumulative irrigation (mm) during the peanut growing season under different ENSO phases Pooled data: Planting dates (9) Soil types (3 per county)
 during the peanut growing season under different ENSO phases Pooled data: Planting dates (9) Soil types (3 per county)")
19
CDF : Irrigation Amount Worth County

20
CDF : Irrigation Amount Worth County

21
CDF : Irrigation Amount Worth County

22
CDF : Irrigation Amount Calhoun County

23
Irrigation Amount

24
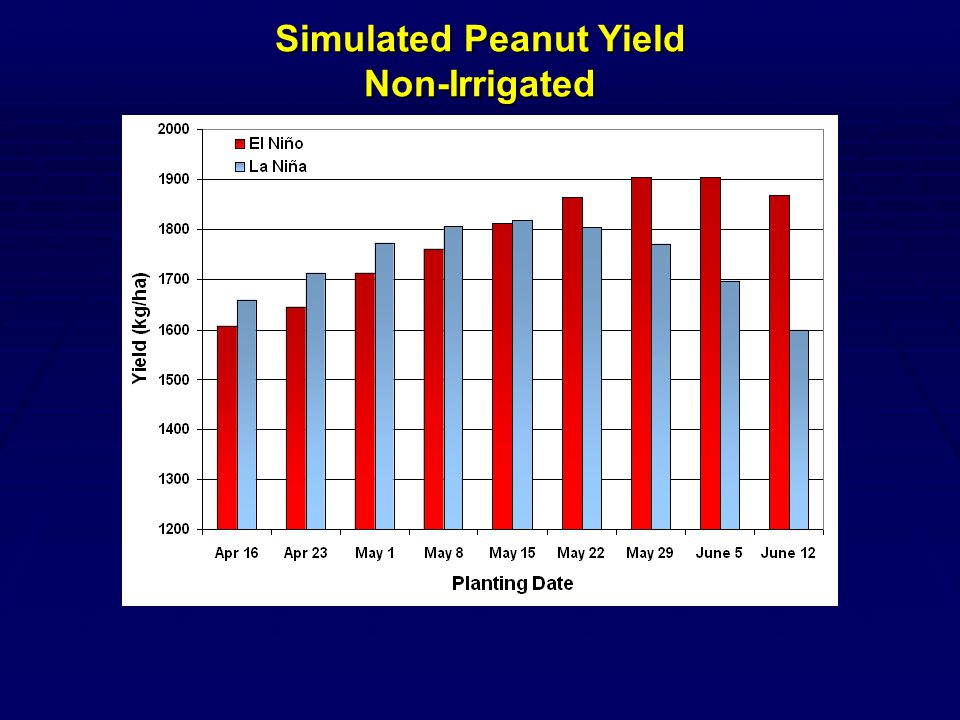
Best window Simulated Peanut Yield Non-Irrigated

27
AgClimate Website http://www.agclimate.org

28
AgClimate Tools

29
Simulated Crop Yield Select 1 planting date Compare ENSO phases

30
Simulated Crop Yield

31
County Yield Database

32
For additional climate information visit www.agclimate.org For current weather visit www.georgiaweather.net Dr. Joel Paz UGA BAE Dept 770-228-7399 jpaz@uga.edu

34
Deviation from Normal Jan 1 – June 15 Source: Georgia Weather Network (www.georgiaweather.net)

Similar presentations


 (Revised: May 26, 2012) This product is published by the Oregon Department of Agriculture (ODA), in cooperation.>")


 Pacific Decadal Oscillation Annular modes.>")


 Physical Oceanography>")

