Download presentation
Presentation is loading. Please wait.

1
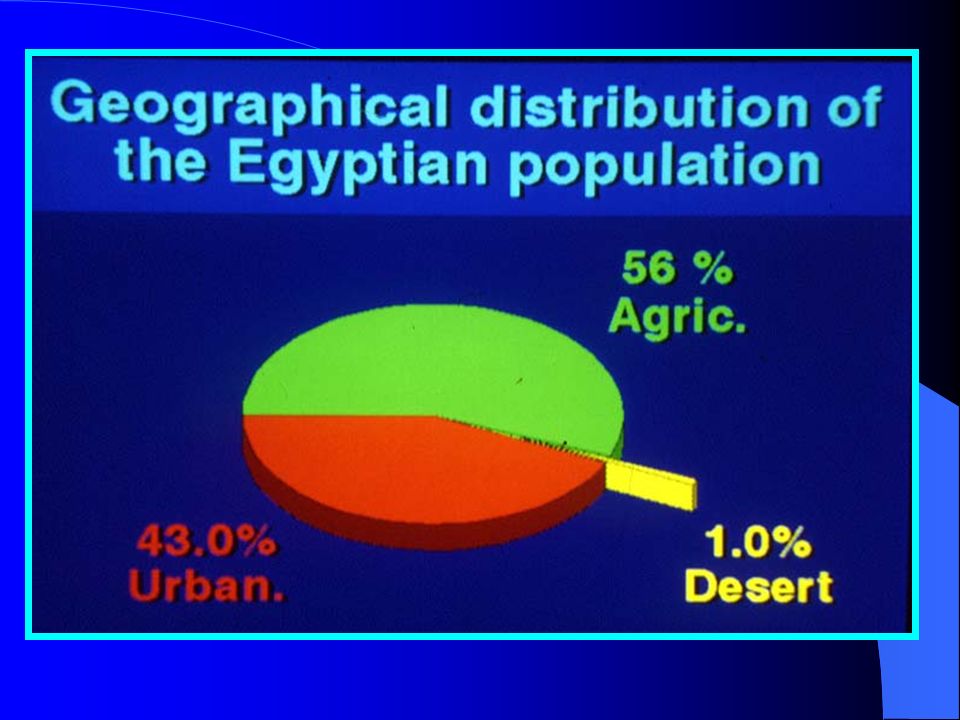
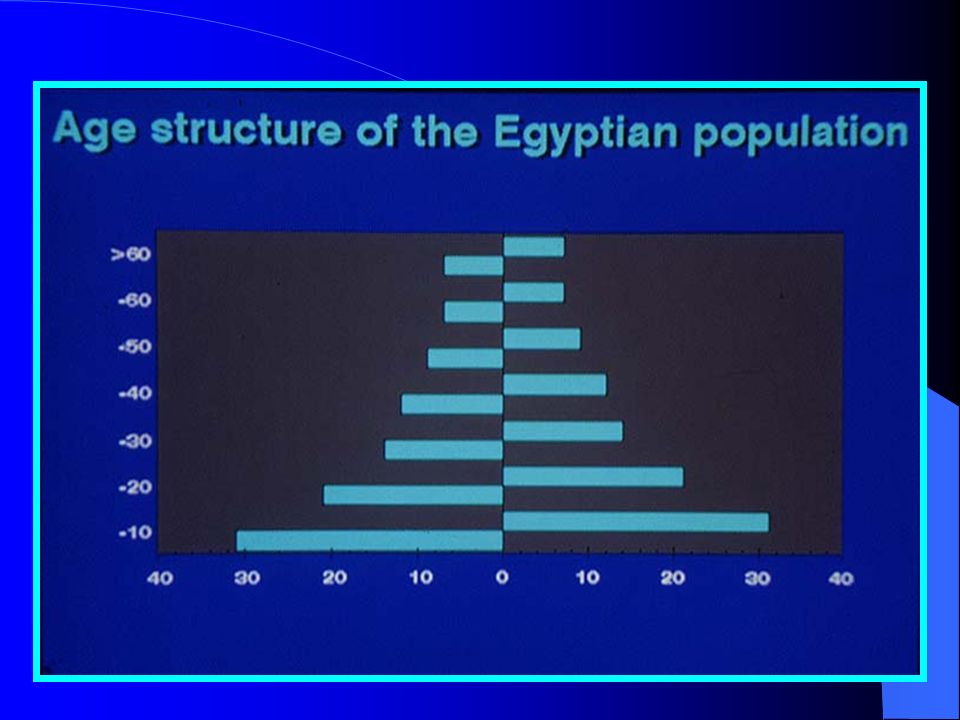
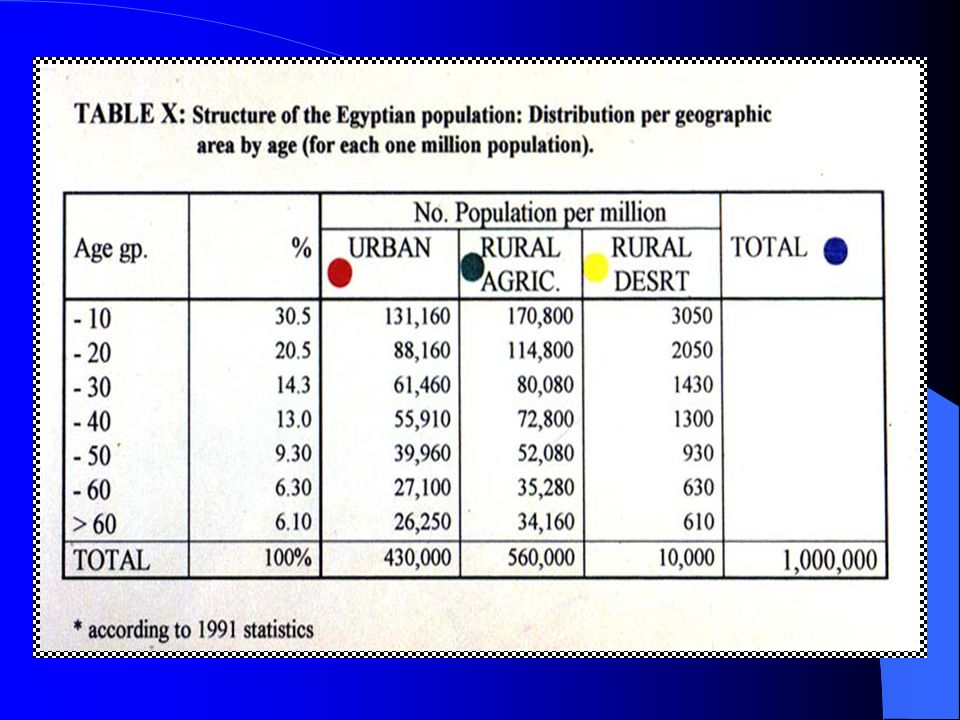
Diabetes in Egypt (2003) Prof. Morsi Arab
 Prof. Morsi Arab")
21
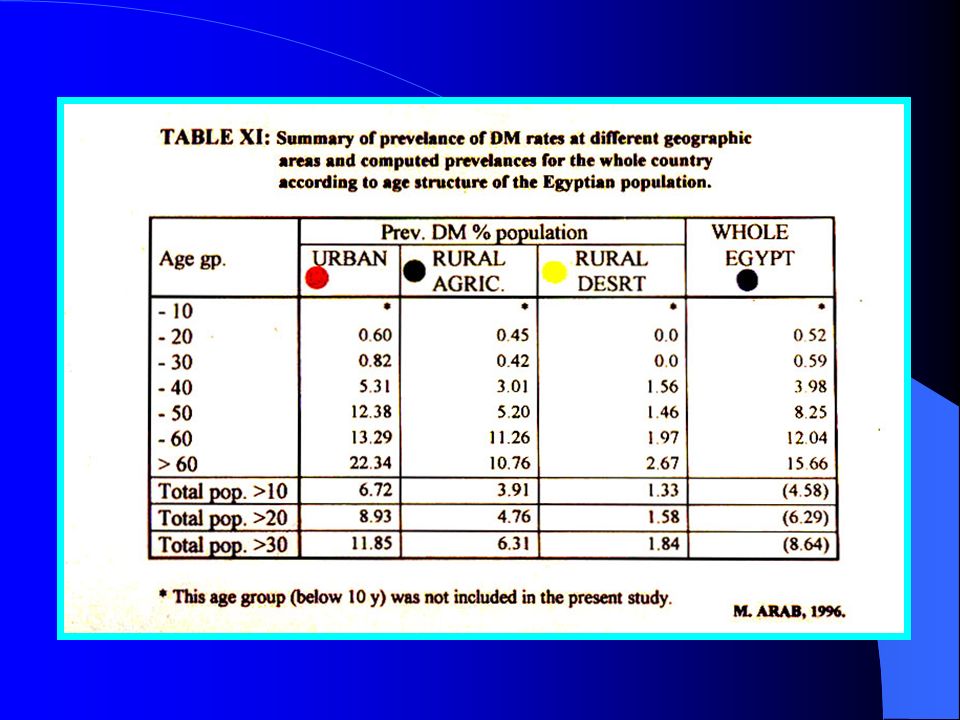
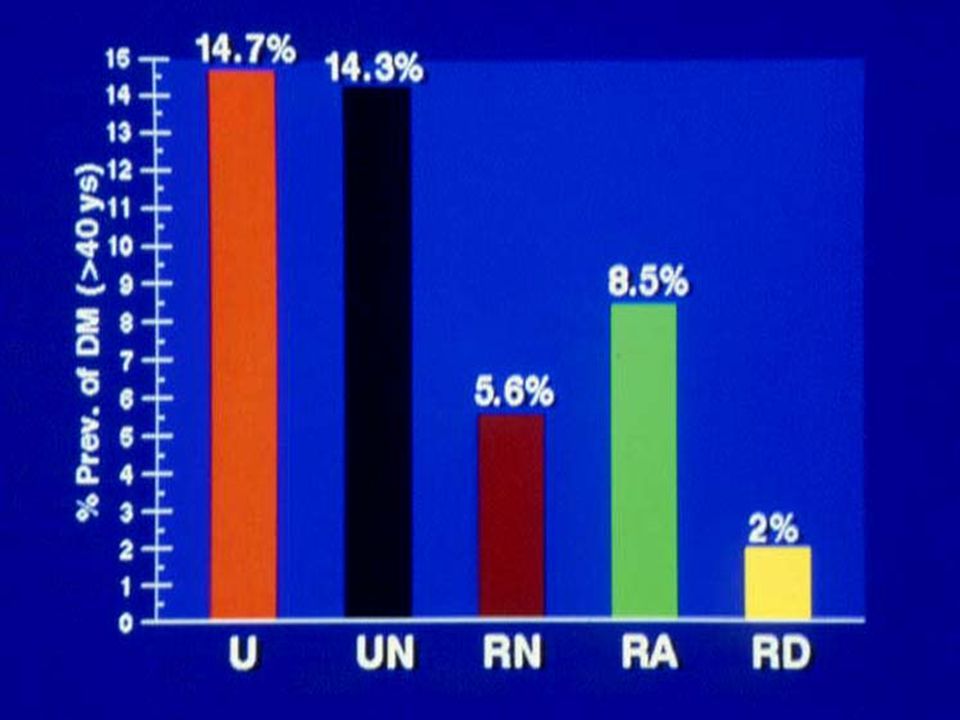
PREVELANCE OF COMPLICATIONS OF DIABETES MELLITUS IN EGYPT

22
Alex 1 Menoufeya 2 El Menia 3 Assiut 4 Mansoura 5 El Behira 6 Kafr El Sheikh 7 Matrouh 8 Other Govern. 9

23
Total (n) > 7040-7020-40< 20Age (Year) 940 (100%) 5.5%77.8%12.6 %4.1 % M. 1060 (100%) 4.1%80.0%12.3 %3.6% F. Age and Sex ( percent )
 4.1%80.0%12.3 %3.6% F. Age and Sex ( percent ).")
24
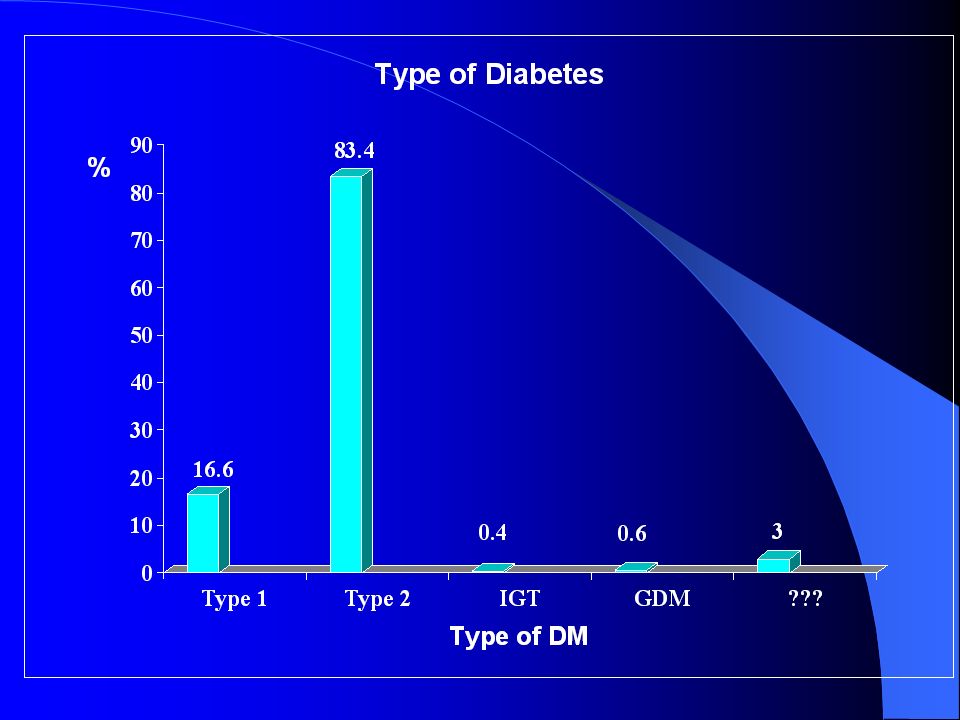
16.6 %Type 1 83.4 %Type 2 0.4 %IGT 0.6 %GDM 3.0 %? Not well defined Type of Diabetes

26
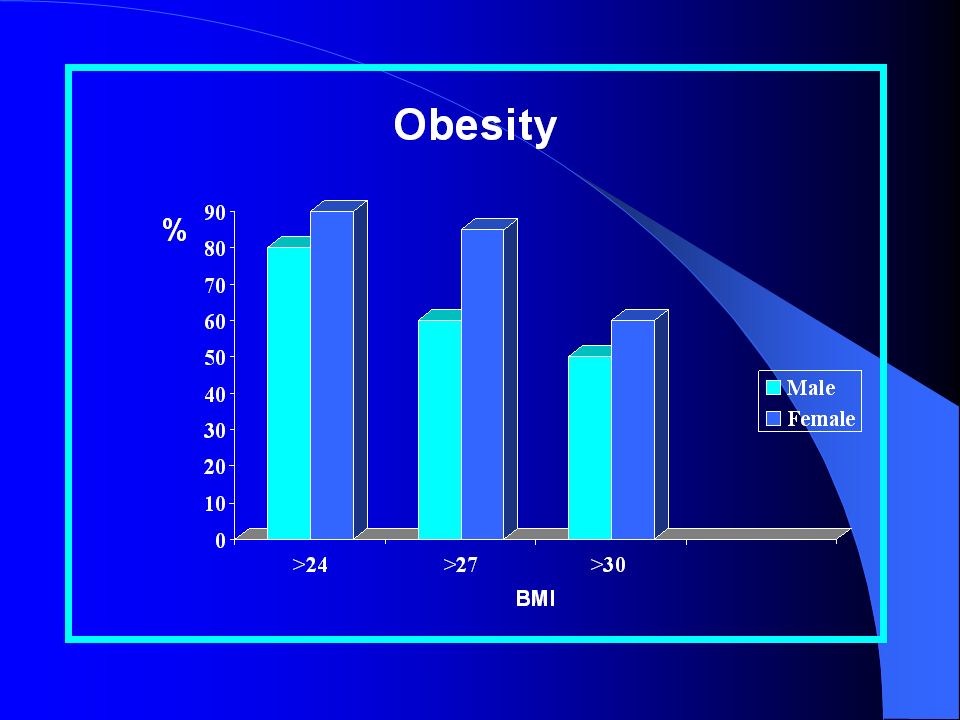
Over 30 (very obese) Over 27 ( Obese) Over 24 (overweight) BMI Obesity 38.5 %62.6 %81.2 %Male 60.5 %77.5 %90%Female BMI Increased BMI and Gender
 Over 27 ( Obese) Over 24 (overweight) BMI Obesity 38.5 %62.6 %81.2 %Male 60.5 %77.5 %90%Female BMI Increased BMI and Gender")
29
Fertility; Abortions and Labour in Diabetic Females. (among 1060 diabetic females) The average number of normally born children / pt = 3.6 - The average number of normally born children / pt = 3.6 - The average number of aborted children / pt = 0.9 - The frequency of abortions among all pregnancies = 21.5% - The average frequency of Caesarian labour = 4.7 %
 The average number of normally born children / pt = The average number of normally born children / pt = The average number of aborted children / pt = The frequency of abortions among all pregnancies = 21.5% - The average frequency of Caesarian labour = 4.7 %.")
30
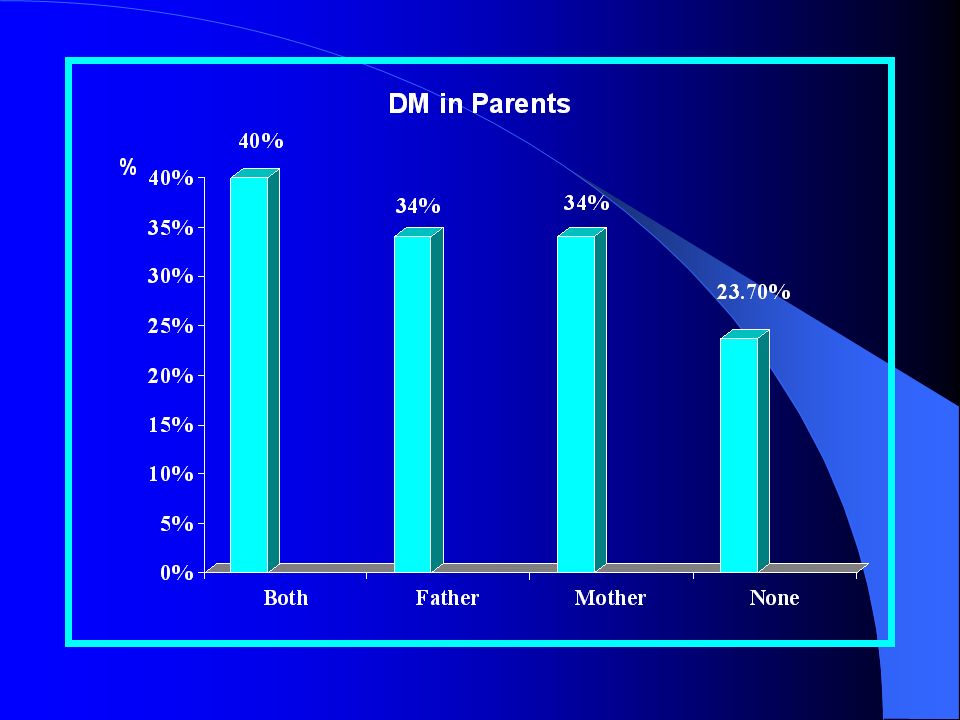
Parental History of Diabetes Diabetic Mother in : 29.1 % Diabetic Father in : 22.3 % Both parents in : 7.8 % Neither Parents in :39.3 % Parental History of Diabetes Diabetic Mother in : 29.1 % Diabetic Father in : 22.3 % Both parents in : 7.8 % Neither Parents in :39.3 %

32
Fasting Hyperglycemia - Controlled (< 120 mg/dl ) = 19.8 % - Total Uncontrolled = 80.2 % Hyperglycemic 121-150 mg/dl = 15.6 % Marked hyperglycemia 151-200 = 31.3 % Severe hyperglycemia 211-220 = 12.5 % Very severe hyperglycemia > 220 = 20.8 %
 = 19.8 % - Total Uncontrolled = 80.2 % Hyperglycemic mg/dl = 15.6 % Marked hyperglycemia = 31.3 % Severe hyperglycemia = 12.5 % Very severe hyperglycemia > 220 = 20.8 %")
33
Post Prandial Hyperglycemia - Controlled < 160 mg/dl = 13.5 % - Accepted 161-180 mg/dl = 7.9 % Total = 21.4 % - Uncontrolled >180 mg/dl = 78.6 % * Moderate 181-220 mg/dl = 17.4 % * Severe 221- 260 mg/dl = 16.0 % * Very Severe > 260 mg/dl = 45.2 % TOTAL = 100 %

34
Total> 120-110- 100- 90< 80Diast. B.P. mm Hg 192615862323491244 (n) 100%0.74.512.118.1 (64.6) % ( 35.4 ) Uncontrolled Diastolic Hypertension
 100% (64.6) % ( 35.4 ) Uncontrolled Diastolic Hypertension.")
35
Total> 200- 200- 180-150< 130SBP (mmHg) 192810543994301035(n) 100 %0.52.820.722.353.7 % ( 46.3 )( 53.7) Uncontrolled Systolic Hypertension
 (n) 100 % % ( 46.3 )( 53.7) Uncontrolled Systolic Hypertension")
36
Diabetes KetoAcidosis (DKA) - Incidence ( among all patients at all frequencies at any time of the duration of diabetes ) = 12.2 %. - The mean age in patients who developed DKA ( at least once in life ) = 42.5 years - The mean age in patients who never developed DKA = 53.1 years Diabetes KetoAcidosis (DKA) - Incidence ( among all patients at all frequencies at any time of the duration of diabetes ) = 12.2 %. - The mean age in patients who developed DKA ( at least once in life ) = 42.5 years - The mean age in patients who never developed DKA = 53.1 years
 = 42.5 years - The mean age in patients who never developed DKA = 53.1 years Diabetes KetoAcidosis (DKA) - Incidence ( among all patients at all frequencies at any time of the duration of diabetes ) = 12.2 %. - The mean age in patients who developed DKA ( at least once in life ) = 42.5 years - The mean age in patients who never developed DKA = 53.1 years.")
37
Hypoglycemia - Incidence of Hypoglycemic episodes at any frequency and at any time during the course of Diabetes. Among 1588 patients was = 20.5% - The mean age of patients who developed hypoglycemic episodes at any time = 50.8 years - The mean age of patients who did not experience hypoglyceamic episodes = 52.1 years

38
Total> 250201-250151-200< 150 S. Cholesterol mg/dl 1246130413592111Pts (n) (10.4%)(33.2%)(47.5%)(8.9%)% (43.6%) (56.4% ) Serum Cholesterol and Hypercholsterolemia
 (10.4%)(33.2%)(47.5%)(8.9%)% (43.6%) (56.4% ) Serum Cholesterol and Hypercholsterolemia.")
39
Cardiac Complications Angina = 15.0 % Positive E.C.G. Changes : 7.9 % Signs of Cardiac Dysfunction: 21.3 % (C. H.V. and or arrhythmia ) Cardiac Complications Angina = 15.0 % Positive E.C.G. Changes : 7.9 % Signs of Cardiac Dysfunction: 21.3 % (C. H.V. and or arrhythmia )
 Cardiac Complications Angina = 15.0 % Positive E.C.G. Changes : 7.9 % Signs of Cardiac Dysfunction: 21.3 % (C. H.V. and or arrhythmia ).")
40
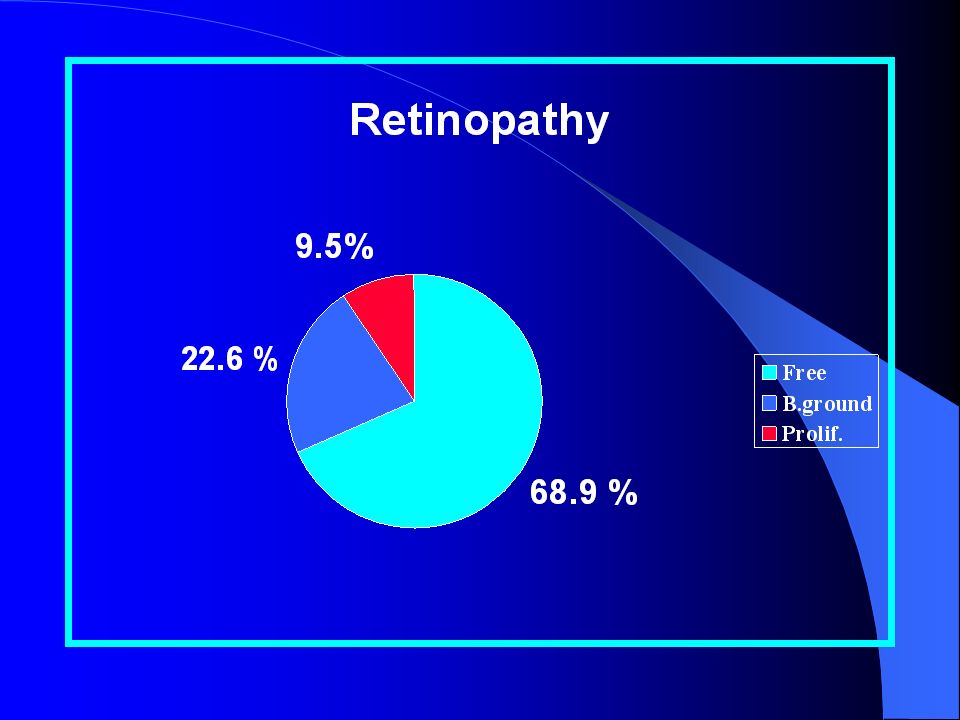
Retinopathy ( in 1173 patients ) - Free 68.9 % - Back ground 22.6 % - Proliferative 9.5 %
 - Free 68.9 % - Back ground 22.6 % - Proliferative 9.5 %")
42
Serum Creatinine Total> 2.01-2< 10Mg/dl 132571620634 n 100%5%4748 %

43
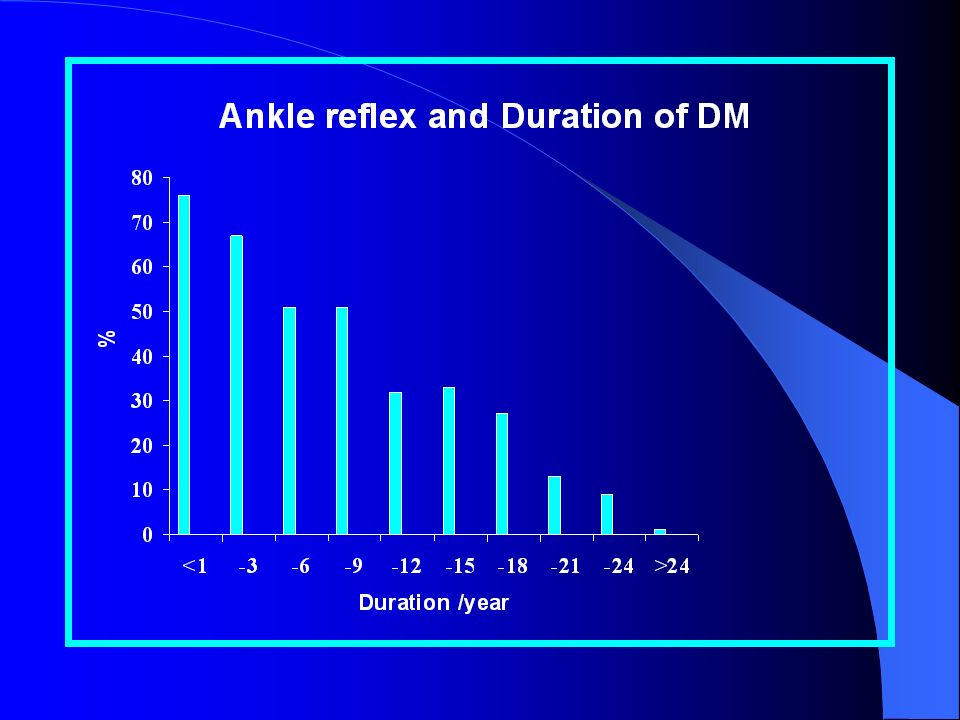
Loss of AR and Duration of DM >24-24-21-18-15-12-9-6-3>1Duration ( Y ) 191327333251 6776% of Present / total Ankle Reflex as early indicator of neuropathy n 1833 pts., AR was : - present in 44.5 % - absent in 55.5 %
 % of Present / total Ankle Reflex as early indicator of neuropathy n 1833 pts., AR was : - present in 44.5 % - absent in 55.5 %")
45
Prevalence of foot complications among diabetic patients Among 2000 patients : 1- Fungus infection = 22.0 % 2- Foot ulcers = 6.8 % 3- Evident Ischaemic changes = 9.7 % 4- Amputations = 3.0 % 5- Deformities = 1.0 %

46
Treatment by Insulin I- Out of 2000 diabetic patients : - 882 are insulin recipients ( 44.1 %) - 199 are on animal insulin ( 23 % ) - 683 are on Human insulin ( 77 %) II- The average total daily dose = ( 45.5 units) - 34.1 % of pts on ( one ) injection - 58.4 % of pts on ( two ) injections) - 7.5 % of pts on multiple injections III- The form of insulin received is - Intermediate in 83.0% - Mixed in 14.6 % - Short in 4.2 %
 are on animal insulin ( 23 % ) are on Human insulin ( 77 %) II- The average total daily dose = ( 45.5 units) % of pts on ( one ) injection % of pts on ( two ) injections) % of pts on multiple injections III- The form of insulin received is - Intermediate in 83.0% - Mixed in 14.6 % - Short in 4.2 %")
57
The Extra Burden of Cost of Treatment of Complicated Diabetes at a Private Alexandria Hospital, 2001 ( average of 100 diabetic patients ).
.")
58
Distribution of costs of Hospital Treatment of Diabetic Patients ( L.E. per day ) at a Private Hospital for Middle Class Egyptian Population at the City of Alexandria, Egypt 2001
 at a Private Hospital for Middle Class Egyptian Population at the City of Alexandria, Egypt")
59
Estimated Costs of Ambulatory (out patient) Treatment of Diabetes in Egypt at 2001 Cost Prices in USD/ year Estimated Costs of Ambulatory (out patient) Treatment of Diabetes in Egypt at 2001 Cost Prices in USD/ year (A) Insulin ( Dose 10-80 units /d ) (B) Oral Antidiabetic Agents * Heavily subsidized ** moderately subsidized
 Treatment of Diabetes in Egypt at 2001 Cost Prices in USD/ year Estimated Costs of Ambulatory (out patient) Treatment of Diabetes in Egypt at 2001 Cost Prices in USD/ year (A) Insulin ( Dose units /d ) (B) Oral Antidiabetic Agents * Heavily subsidized ** moderately subsidized")
60
Estimated Costs of Ambulatory (out patient) Treatment of Diabetes in Egypt at 2001 Cost Prices in USD/ year ( Cont.) Estimated Costs of Ambulatory (out patient) Treatment of Diabetes in Egypt at 2001 Cost Prices in USD/ year ( Cont.) ( C ) Other costs at average frequencies per year Laboratory, and other follow – up investigations (E.C.G radiol., etc. ) Physician fees and other specialist consultations Total 143 USD/Year ( C ) Other costs at average frequencies per year Laboratory, and other follow – up investigations (E.C.G radiol., etc. ) Physician fees and other specialist consultations Total 143 USD/Year 76.4 66.6 76.4 66.6
 Physician fees and other specialist consultations Total 143 USD/Year ( C ) Other costs at average frequencies per year Laboratory, and other follow – up investigations (E.C.G radiol., etc. ) Physician fees and other specialist consultations Total 143 USD/Year")
61
The Burden of the Cost of Ambulatory Treatment of Diabetes on Individuals at Low-Income and High-Income Middle East Countries, based on the Cost Prices of Insulins and Oral Antidiabetic Agents (in USD per year) * Heavily subsidized ** moderately subsidized
 * Heavily subsidized ** moderately subsidized")
62
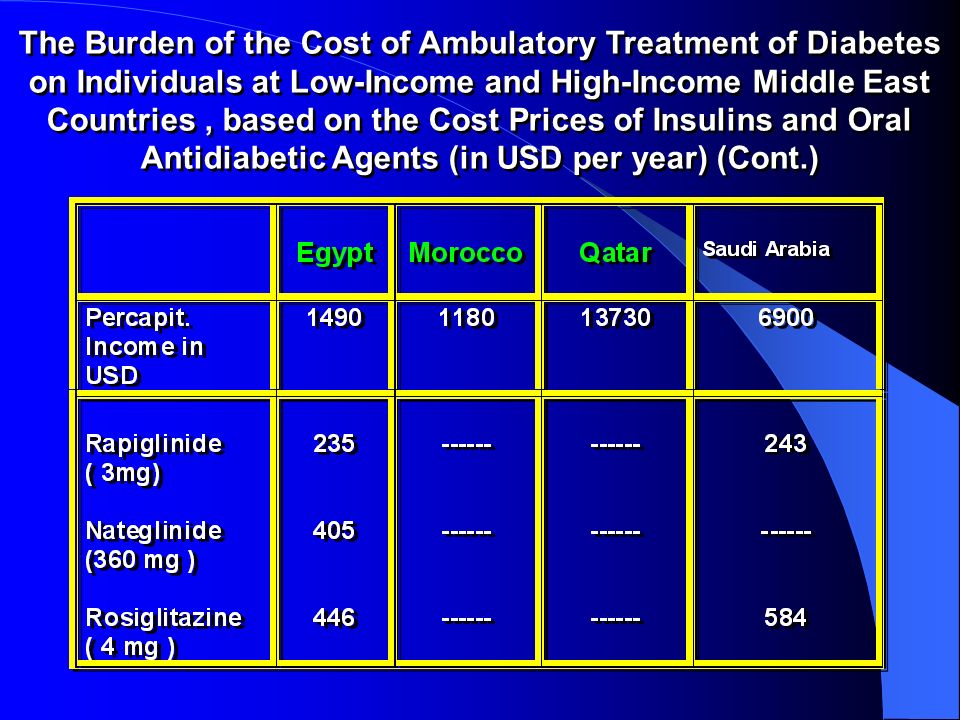
The Burden of the Cost of Ambulatory Treatment of Diabetes on Individuals at Low-Income and High-Income Middle East Countries, based on the Cost Prices of Insulins and Oral Antidiabetic Agents ( in USD per year) (Cont.)
 (Cont.)")
64
Thank You

Similar presentations


 Any Glucose Level Age Rapid onset Weight loss Tablets fail Pregnancy Illness Ketoacidosis Pancreat-ectomy.>")


 Fellow of KIMS Endocrine, Diabetes and Metabolism.>")


>")


![LIFESTYLE MODIFICATIONS FOR PREVENTING HEART DISEASE [e.g. HEART ATTACKS] [ primary prevention of coronary artery disease ] DR S. SAHAI MD [Med.], DM [Card]](/19/5810187/big_thumb.jpg "LIFESTYLE MODIFICATIONS FOR PREVENTING HEART DISEASE [e.g. HEART ATTACKS] [ primary prevention of coronary artery disease ] DR S. SAHAI MD [Med.], DM [Card]>")

 definition According to the new IDF definition, for a person to be defined as having the metabolic syndrome.>")


