Download presentation
Presentation is loading. Please wait.

1
Tools of Science - Scientific Method Definition Observe Hypothesis Experiment Data Analysis Conclusion Theory Loose guidelines in conducting an experiment Don't always go in order and aren't always written out Done through the 5 senses A testable statement written in an “If...Then” format NOT an guess, even an educated one A controlled set of steps designed to lead to either the acceptance or rejection of the hypothesis Information collected in an experiment 2 forms: Quantitative- Numbers- answers “When, How much” Qualitative- Descriptions- answers “What, Where, Who” Finding logical patterns among that data Usually done through graphing/charting Restates what occurred, postulates probable reasons based on data/research, questions further Scientific law based on experimental evidence and only after repeated testing of a hypothesis gives alike results OL

2
Tools of Science – Metric System Definition Units Metric Prefixes Standard system of measurement in science Also known as SI system. Differs from what we use in the US Meters-(m)- measures length/distance Grams- (g)- weight/mass Liters- (L)- measures volume (usually of liquids) Celsius (C)- measures temperature Seconds (s)- measures time Measuring something very heavy in grams would give a massive number too big to comprehend. The reverse is true as well. Because of this the metric system uses prefixes to express grams, meters, and liters in both very small and very big units The prefixes are: Kilo (K)- 1,000deci (d)- 0.1 Hecto (H) - 100centi (c)- 0.01 Deca (D)- 10milli (m)- 0.001 Ex. A car would be 2,000,000 grams, or 2,000 kilograms, or 2 tonnes OL
- measures length/distance Grams- (g)- weight/mass Liters- (L)- measures volume (usually of liquids) Celsius (C)- measures temperature Seconds (s)- measures time Measuring something very heavy in grams would give a massive number too big to comprehend. The reverse is true as well. Because of this the metric system uses prefixes to express grams, meters, and liters in both very small and very big units The prefixes are: Kilo (K)- 1,000deci (d)- 0.1 Hecto (H) - 100centi (c) Deca (D)- 10milli (m) Ex. A car would be 2,000,000 grams, or 2,000 kilograms, or 2 tonnes OL.")
3
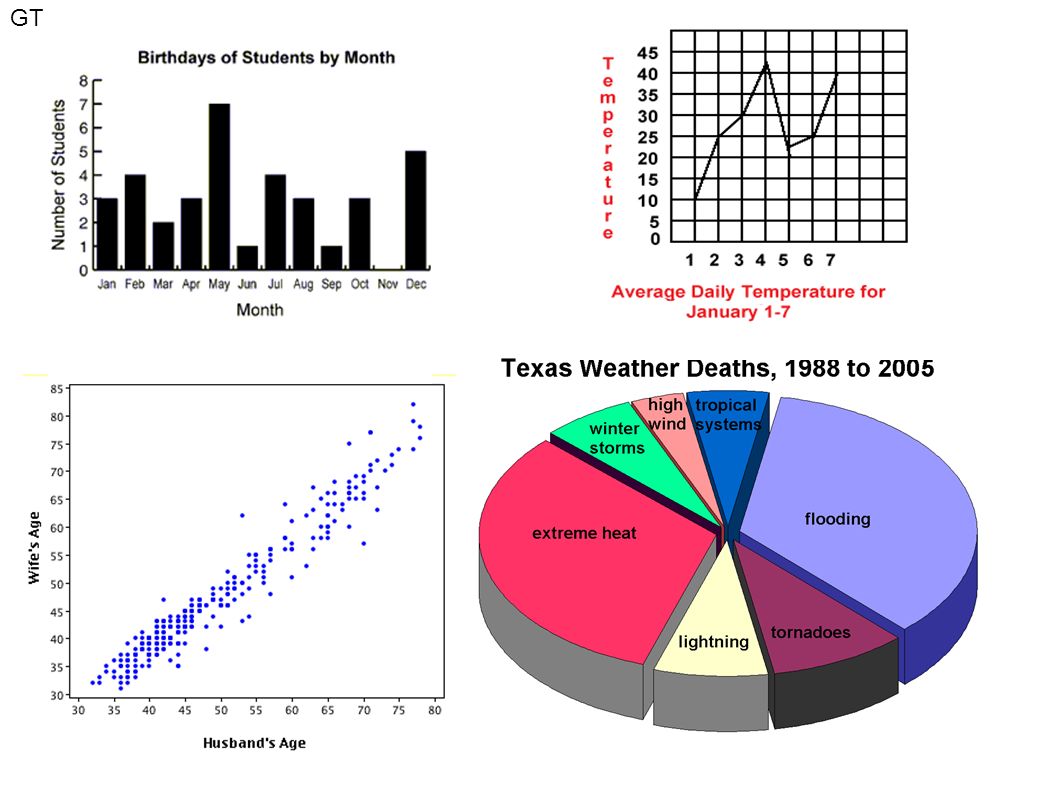
Tools of Science - Graphing Purpose Bar Graph Line graph Pie graph Scatter Plot Parts of a good graph A way to express data in a format that is easy to read and understand Different graphs work best for different types of data Best for data that is partially qualitative Ex. Numbers of each color of M&M in a package Best for data that is entirely quantitative AND related Ex. Plant growth in cm over time in days Best for data expressed as fractions or percents- usually partially qualitative as well Ex. Percent of kids that did homework vs. watched TV last night Best for data that is quantitative but not related Ex. Husband's age vs. Wife's age Title- needs to say EXACTLY what the graph shows Labeled axes- what axis is showing and in what units Appropriate scale- don't start at 0 if your data starts at 200 and ends at 202 Percent signs where necessary OL

5
Tools of Science – Experimental Design Purpose Parts The goal of all experiments is to be reproducible and well designed Objective- what it is you are trying to discover in an experiment Ex. To determine which fertilizer causes more rapid plant growth Independent Variable (IV)- the thing I (the experimenter) change from experimental group to experimental group Ideally, each experiment will only have one- this ensures the results were caused by this change and this change alone Ex. The different types of fertilizer Dependent Variable (DV)-the results of the experiment The results depend on what I change between groups Ex. How much each plant grows Control- the experimental group which DOES NOT receive the independent variable Used to show that the IV had any effect at all Ex. A plant with plain soil- no fertilizer added Constants- other variables in the experiment which remain the same between groups to ensure validity. Ex. Light, water, how much soil etc. OL
- the thing I (the experimenter) change from experimental group to experimental group Ideally, each experiment will only have one- this ensures the results were caused by this change and this change alone Ex. The different types of fertilizer Dependent Variable (DV)-the results of the experiment The results depend on what I change between groups Ex. How much each plant grows Control- the experimental group which DOES NOT receive the independent variable Used to show that the IV had any effect at all Ex. A plant with plain soil- no fertilizer added Constants- other variables in the experiment which remain the same between groups to ensure validity. Ex. Light, water, how much soil etc. OL.")
6
Tools of Science - Scientific Method Definition Observe Hypothesis Experiment Data Analysis Conclusion Theory Guidelines in experimentation Ø in order, Ø all written 5 senses Testable statement in “If...Then” format NOT an guess Controlled steps → Accept/Reject Hypothesis Info collected 2 forms: Quantitative- #'s Qualitative- words Logical patterns in data → Graphs/Charts Restates, explain, postulate, question Scientific law Only if repeated tests → Like results Correlation Ø Causation GT

7
Tools of Science – Metric System Definition Units Metric Prefixes System of measurement in science a.k.a SI system Meters-(m)- length/distance Grams- (g)- weight/mass Liters- (L)- volume ) Celsius (C)- temperature Seconds (s)- time Big/small numbers are hard so use prefixes Prefixes: Kilo (K)- 1,000deci (d)- 0.1 Hecto (H) - 100centi (c)- 0.01 Deca (D)- 10milli (m)- 0.001 GT
- length/distance Grams- (g)- weight/mass Liters- (L)- volume ) Celsius (C)- temperature Seconds (s)- time Big/small numbers are hard so use prefixes Prefixes: Kilo (K)- 1,000deci (d)- 0.1 Hecto (H) - 100centi (c) Deca (D)- 10milli (m) GT")
8
Tools of Science - Graphing Purpose Bar Graph Line graph Pie graph Scatter Plot Parts of a good graph Express data-easy to read/understand Different graphs best for different data Partially qualitative data Entirely quantitative AND related Fractions or percents-?partially qualitative? Quantitative but not related Title Labeled axes/units Appropriate scale %'s if needed GT

10
Tools of Science – Experimental Design Purpose Parts When graphing Reproducible & well designed Objective- hopeful outcome Independent Variable (IV)- changed from experimental group to group Only 1/experiment- helps = causation Dependent Variable (DV)-results Control- group which DOES NOT receive IV Shows if IV had any effect Constants- All other variables- must stay steady DRY MIX GT
- changed from experimental group to group Only 1/experiment- helps = causation Dependent Variable (DV)-results Control- group which DOES NOT receive IV Shows if IV had any effect Constants- All other variables- must stay steady DRY MIX GT")
Similar presentations


>")


