Download presentation
Presentation is loading. Please wait.

1
Year 3 Research and Priorities Jeremy Testa Horn Point Laboratory December 9, 2008 Primary Scientific Question What C sources are missing from the Bay Program Water Quality model, leading to failed predictions of hypoxic volume? Relevant Questions from proposal: B) Production in the flanking shoal areas (1) same integrated P but less R means more TOC export (2) benthic primary production as source (3) spring bloom versus summer production sources (4) mechanisms for cross-bay transport of TOC
 Production in the flanking shoal areas (1) same integrated P but less R means more TOC export (2) benthic primary production as source (3) spring bloom versus summer production sources (4) mechanisms for cross-bay transport of TOC.")
2
1)Why can’t current water quality models capture oxygen minima? Current WQ model fails to capture O2 minima in Chesapeake Bay bottom waters Why? 1) Transport of C from shoals to deep waters not part of model 2) Alternate C source to fuel respiration not included (“buried C”, primary production)
 Transport of C from shoals to deep waters not part of model 2) Alternate C source to fuel respiration not included ( buried C , primary production).")
3
How to investigate? (1) Do comparison between modeled and measured O2 at all hypoxic stations (2) Quantify difference as “net respiration” (3) Distribute “net respiration” over entire hypoxic volume – compute net missing BOD (4) Investigate possible C sources Collaborations: (1)Rebecca and Bill – testbed queries and error analysis (2)Delaware group – analysis of PP and nutrient load related to “net un-modeled R”
 Do comparison between modeled and measured O2 at all hypoxic stations (2) Quantify difference as net respiration (3) Distribute net respiration over entire hypoxic volume – compute net missing BOD (4) Investigate possible C sources Collaborations: (1)Rebecca and Bill – testbed queries and error analysis (2)Delaware group – analysis of PP and nutrient load related to net un-modeled R .")
4
To Quantify “Missing Carbon” 1) “Net unmodeled respiration” = Model – OBS 2) “Missing C” = “Net unmodeled Respiration” *V * C/O 2 3) Integrate over time with an appropriate scheme to quantify rates Question set 1: Computational details -Match observation to closest model point or average both? -How to interpolate (time + space)? Question set 2: Analysis of missing C -How much C is missing? -Where is the missing C? -When is the C missing? CBP 13k model versus observations Observation Model Cell
. Question set 2: Analysis of missing C -How much C is missing. -Where is the missing C. -When is the C missing. CBP 13k model versus observations Observation Model Cell.")
5
Initial Analyses Surface vs. Bottom 1) Surface performs better than bottom 2) Model especially bad < 4 mg/l
 Surface performs better than bottom 2) Model especially bad < 4 mg/l.")
6
Initial Analyses Spring versus summer 1) Model better in spring 2) No low O2 in spring, however
 Model better in spring 2) No low O2 in spring, however")
7
Middle versus Lower Bay 1) During dry year – middle compares favorably, but not lower 2) During wet year – both middle and lower perform poorly
 During dry year – middle compares favorably, but not lower 2) During wet year – both middle and lower perform poorly")
8
Why the shift in relationship between nutrient loading and hypoxia after 1980? A) Process hypotheses (1) redox-induced increase nutrient recycling efficiency (2) loss of biological nutrient sinks (oysters, marshes, SAV) (3) shoaling of pycnocline & hypsographic threshold (4) regime shift in oceanographic circulation B) Artifact hypotheses (1) abrupt increase in N-loading not apparent in Susquehanna R. (2) increased O 2 sampling intensity yields higher hypoxia volume (3) aliased interpolation leads to miscalculation of hypoxia volume (4) shift from N- to P-limitation
 Process hypotheses (1) redox-induced increase nutrient recycling efficiency (2) loss of biological nutrient sinks (oysters, marshes, SAV) (3) shoaling of pycnocline & hypsographic threshold (4) regime shift in oceanographic circulation B) Artifact hypotheses (1) abrupt increase in N-loading not apparent in Susquehanna R. (2) increased O 2 sampling intensity yields higher hypoxia volume (3) aliased interpolation leads to miscalculation of hypoxia volume (4) shift from N- to P-limitation.")
9
2) How have sediment nutrient cycling and oxygen demand contributed to Chesapeake Bay hypoxia regime shift? Chesapeake Bay Box Model – Examining shifts in O 2, NH4, and DIP net biogeochemical production from 1960 to present Examine long-term patterns water O2 uptake and nutrient regeneration Examine long-term patterns in surface layer productivity and organic fluxes to sediments Advantages – 1)Box model already built and has been shown to have high utility in Chesapeake Bay 2)Model provides a tool to examine past 40 years of O 2 and nutrient dynamics Disadvantages – 1)Course scale, 2)Error difficult to quantify 3)Data limitations for multi-decade analysis
Box model already built and has been shown to have high utility in Chesapeake Bay 2)Model provides a tool to examine past 40 years of O 2 and nutrient dynamics Disadvantages – 1)Course scale, 2)Error difficult to quantify 3)Data limitations for multi-decade analysis.")
10
CB Box Model?

11
What has not been done? Computations of nutrient production, consumption and transport? July 2003

12
What to do 1)Derive flux computation from WQ model compare to Box model? 2) Time series on N flux?
Derive flux computation from WQ model compare to Box model 2) Time series on N flux")
13
July 2003 July 2002 July 1965 July 1970

14
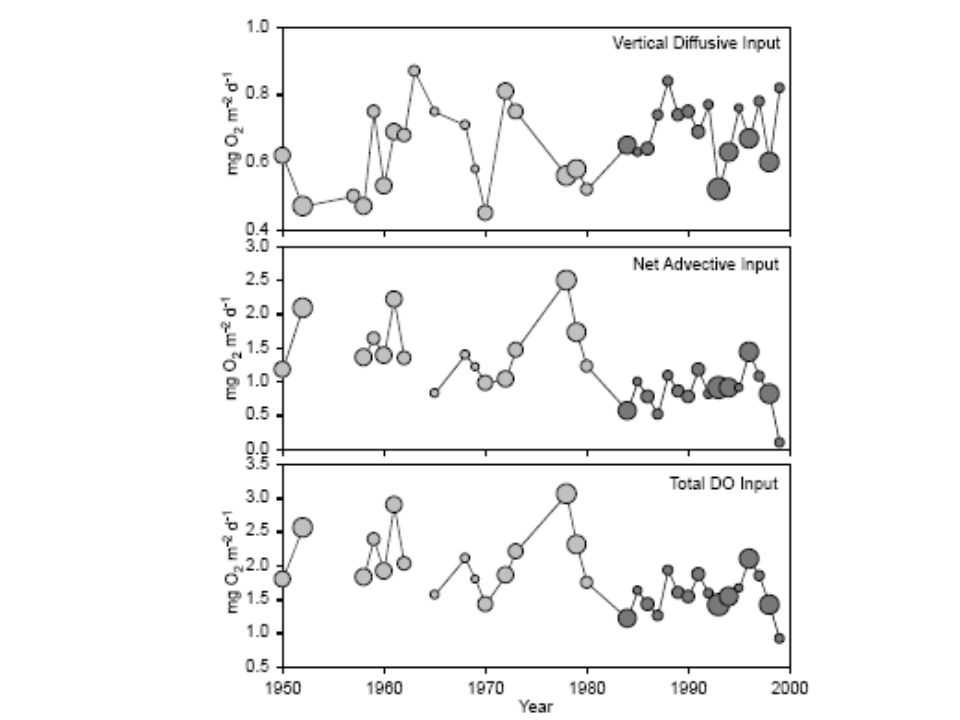
What has been done? Computations of O2 production, consumption and transport?

Similar presentations


 Need to relate “today’s”>")

 CMORE Cruise, July 30 - August 14, 2008 Objective: To explore the potential and limitations of perturbation experiments.>")


 Review 09 – 11 March 2010 Satellite Observations of Seasonal Sediment Plume in the Central East China.>")
 Measuring Dissolved Oxygen Measuring 1º Production and Respiration.>")
