Download presentation
Presentation is loading. Please wait.

1
Monitoring and Pollutant Load Estimation

2
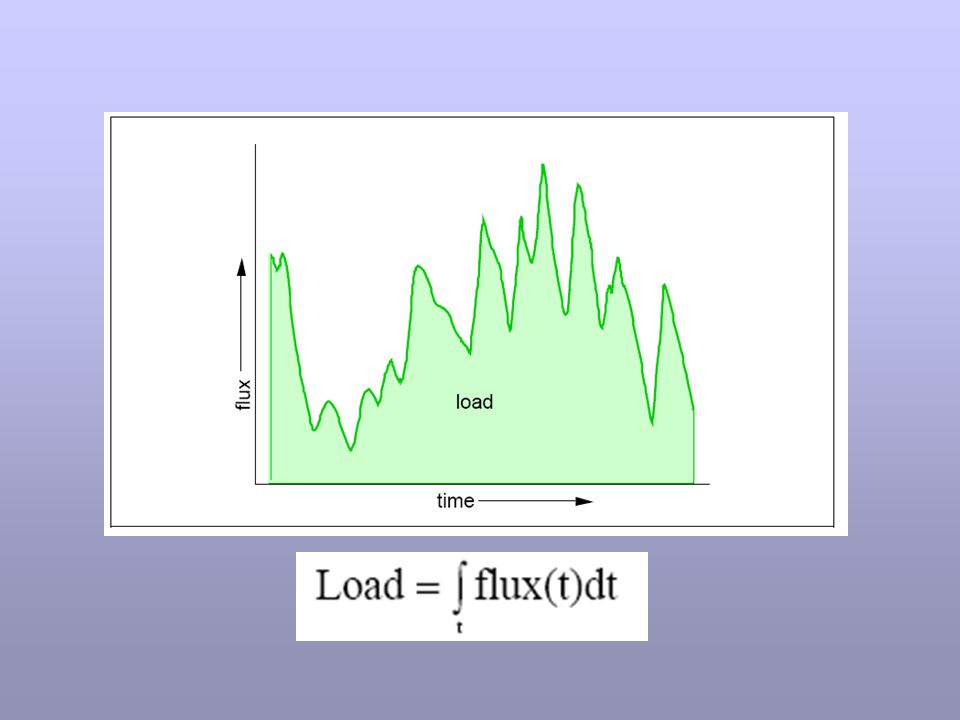
Load = the mass or weight of pollutant that passes a cross-section of the river in a specific amount of time Flux = the instantaneous rate at which the load is passing a point of reference on a river, e.g., a sampling station Discharge = the volume of water that passes a cross-section of the river in a specific amount of time Flow = the instantaneous rate at which water is passing the reference point Definitions

4
However, cannot measure flux directly, so calculate load as product of concentration and flow: Because we must almost always measure concentration in a series of discrete samples, estimation of load becomes sum of a set of products of flow and concentration:

5
daily weekly monthly The central problem becomes how best to set up the discrete samples to give the most accurate estimate of load. how many samples and when to take them

6
Because in nps, most flux occurs during periods of high discharge (~80 – 90% of annual load in ~10 – 20% of time), when to sample is especially important. weekly monthly Quarterly X Monthly X Weekly ?

7
Total load is the load over the main period of interest, e.g., one year is represented as the sum of Unit loads, i.e., individual calculations of load as product of concentration and flow over a smaller, more homogeneous time span. The central problem is to accurate characterize all the unit loads; adding them up to the total load is simple.

8
Practical load estimation Ideally, most accurate approach to load estimation is to sample very frequently and capture all the variability. Flow is relatively straightforward to measure continuously Concentration is expensive to measure and in most cases impossible to measure continuously. Must choose a sampling interval to give an appropriate characterization of concentration component.

9
Practical load estimation Grab samples – represent concentration at a single point in time Fixed-interval (time-proportional) samples – poorly suited for load estimation because they ignore changes in flow that occur between samples and are usually biased toward low flows Flow-proportional samples - ideally suited for load estimation, can provide a precise and accurate load estimate if the entire time interval is properly sampled.
 samples – poorly suited for load estimation because they ignore changes in flow that occur between samples and are usually biased toward low flows Flow-proportional samples - ideally suited for load estimation, can provide a precise and accurate load estimate if the entire time interval is properly sampled.")
10
Practical load estimation In general, the accuracy and precision of a load estimate increases as sampling frequency increases. Sample frequency determines the number of unit load estimates that go into our total load estimate more unit loads mean we are more likely to capture variability across the year and not miss an important event Because of autocorrelation, at some point, greater sample frequency will not improve load estimate

11
Practical load estimation Timing of samples more complex than frequency Selecting when to collect samples for concentration determination = selecting when the unit loads that go into an annual load estimation are determined Consider sources of variability, e.g., season, flow, agricultural activities

12
Practical load estimation 1.Find a way to estimate "missing" concentrations to go with the flows observed at times when chemical samples were not taken. 2. Abandon most of the flow data and calculate the load using the concentration data and just those flows observed at the same time the samples were taken. 3. Do something in between - find some way to use the more detailed knowledge of flow to adjust the load estimated from matched pairs of concentration and flow. X

13
Practical load estimation When decision to calculate loads is made after monitoring program is in place or data collected, little can be done to compensate for a data set that contains too few observations collected using an inappropriate sampling design The sampling needed for load estimation must be established in the initial monitoring design, based on quantitative statements of the precision required for the load estimate to meet project goals.

14
Practical load estimation Is load estimation necessary or can project goals be met using concentration data? Determine precision needed in load estimates – don’t try to document a 25% load reduction from a BMP program with a monitoring program that may give load estimates +50% of the true load. Decide what approach will be used to calculate the loads, based on known or expected attributes of the data. Use the precision goals to calculate the sampling frequency and timing requirements for the monitoring program. Compare ongoing load estimates with program goals of the and adjust the sampling program if necessary.

15
Practical load estimation Someone may say that it’s too expensive or complex to conduct a monitoring program sufficient to obtain good load estimates. Is a biased, highly uncertain load estimate preferable to no load estimate at all?

16
Approaches to load estimation Numeric integration c i = concentration of i th sample q i = corresponding flow t i = time interval represented by i th sample

17
Approaches to load estimation Numeric integration Question becomes how fine to slice the pie – few slices will miss much variability, many slices will capture variability but at a higher cost/effort. Numeric integration is only satisfactory if the sampling frequency is high - often on the order of 100 samples per year or more, and sufficiently frequent that all major runoff events are well sampled. Selection of sample frequency and distribution over the year is critical – must focus on times when highest fluxes occur, i.e., periods of high discharge

18
Approaches to load estimation Numeric integration Flow-proportional sampling Very efficient and cost- effective method of obtaining total load. Requires reliable equipment and careful attention No information available at resolution less than chosen period Not compatible with other goals, such as monitoring for ambient concentrations that are highest at low flow

19
Approaches to load estimation Regression Regression relationship developed between concentration and flow, based on the days on which samples are obtained. Regression relationship used to estimate concentrations for each day on which a sample was not taken, based on the flow (usually the mean daily flow) for the day. The total load is calculated as the sum of the daily loads, obtained by multiplying the measured or estimated concentration by the flow Goal of chemical sampling becomes one to thoroughly characterize the relationship between flow and concentration. May be able to do this with ~20 samples a year, focusing on high-flow or critical season events
 for the day. The total load is calculated as the sum of the daily loads, obtained by multiplying the measured or estimated concentration by the flow Goal of chemical sampling becomes one to thoroughly characterize the relationship between flow and concentration. May be able to do this with ~20 samples a year, focusing on high-flow or critical season events.")
20
Approaches to load estimation Regression Must pay attention to potential changes or trends in conc-flow relationships – especially where BMPs may influence Must manage sampling program to effectively capture range of flows/conditions – using data from fixed-interval time-based sampling is not appropriate

21
Approaches to load estimation Ratio Estimators On days on which samples are taken, the daily load is calculated as the product of concentration and flow, and the mean of these loads is also calculated. The mean daily load is then adjusted by multiplying it by a flow ratio, which is derived by dividing the average flow for the year as a whole by the average flow for the days on which chemical samples were taken. A bias correction factor is included in the calculation, to compensate for the effects of correlation between discharge and load. The adjusted mean daily load is multiplied by 365 to obtain the annual load.

22
Approaches to load estimation Ratio Estimators Stratification - division of the sampling effort or the sample set into two or more parts which are different from each other but relatively homogeneous within, e.g., growing season vs. winter vs. spring May improve precision and accuracy of load estimate by allocating more of the sampling effort to the aspects which are of greatest interest or which are most difficult to characterize because of great variability such as high flow seasons Beale Ratio Estimator is one common technique; computer programs available to implement.

23
Approaches to load estimation 1 – True load (numeric integration 2 – Beale 3 – Regression 4 – Seasonal regression 5 – Beale 6 – Regression 7 – Beale 8 – Regression ~ daily data Weekly (Sunday) Weekly (Friday)
 Weekly (Friday)")
24
Load estimation Load estimation is not a trivial task that can be done as an afterthought Quarterly or even monthly concentration data are unlikely to be adequate for good load estimates Emphasize high-flow events, seasons Estimating load based on cookie-cutter approach or feeding data into a computer program is dangerous If load data are necessary, design monitoring program with load estimation in mind

Similar presentations

>")


 Larry Baxter & Stan Harding Brigham Young University.>")