Download presentation
Presentation is loading. Please wait.

1
Joint FDA and EPA Advisory The Process and Science FDA and EPA Used in Developing the 2004 Mercury Advisory Jim Pendergast Office of Science & Technology, EPA

2
Background 2001 FDA and EPA issued separate national mercury-related advisories on fish consumption. 2002 FDA Food Advisory Committee asked to evaluate the FDA advisory.

3
2001 - FDA Advisory Avoid Shark, Swordfish, King Mackerel, Tilefish –Aimed at women of childbearing age and young children. Eat up to 12oz/week of a variety of other fish –Aimed at women of childbearing age Follow EPA advice for recreationally caught fish

4
2001- EPA Advisory Limit consumption of freshwater fish caught by family and friends to one meal/week Adult -- 6 ounces cooked, 8 ounces uncooked Child --2 ounces cooked, 3 ounces uncooked Applies to areas where states have not provided advice about untested waters Check with state or local health department for advice on waters where friends /family fish Target -- women who are of child-bearing age and children Follow FDA advice for ocean, commercial fish

5
FAC 2002 - Charge The Committee was asked to evaluate whether the FDA’s consumer public health advisory on methylmerury provides adequate protection for pregnant women and women of childbearing age who may become pregnant

6
FAC 2002 - Recommendations Better define what is meant by “eat a variety of fish”, Work with other federal and state agencies to bring commercial and recreational fish under the same umbrella, Publish a quantitative exposure assessment used to develop the advisory,

7
FAC 2002 - Recommendations Develop specific recommendations for canned tuna, based on a detailed analysis of what contribution canned tuna makes to overall methyl mercury levels in women, Address children more comprehensively in the advisory, Increase monitoring of methyl mercury to include levels in fish and the use of human biomarkers.

8
Key Process Milestones Fall 2002: EPA Administrator and Secretary of HHS exchange letters agreeing to collaborate and “bring commercial and recreational fish under the same umbrella advisory”. Feb 2003: Set up joint working and leadership group from FDA/EPA 2002-03: FDA undertakes exposure assessment April 2003 to March 2004: Weekly meetings and joint work between FDA and EPA

9
Early Stakeholder Meetings July 2003 –EPA/FDA met separately with industry, consumers and health professionals, States and Tribes, and, reported on progress in responding to FAC recommendations of July 2002 –Shared with Stakeholders a tentative timeline that included Focus Group testing of a draft advisory in November and a public meeting in Fall of 2003 –Received initial input

10
Drafting and Initial Focus Groups Testing September/October 2003: Developed draft joint advisory and tried to be responsive to FAC comments –Initial draft advisory was 2 and ½ pages in length and contained detailed information November 2003: Focus Group testing and real time revisions –8 Focus Groups in 4 different locations –Testing of advisory resulted in substantial revisions after first Focus Group in Calverton, Maryland: message not received –Lesser refinements occurred after subsequent Focus Groups

11
FDA Food Advisory Committee Review December 2003: Public meeting/presentation at FDA FAC –Summarized background/history –Reminded FAC of comments made in July of 2002 and explained how new draft advisory responded to prior comments –Presented draft advisory (post Focus Groups) –Looked for concurrence on readiness to move forward
 –Looked for concurrence on readiness to move forward")
12
Feedback from December 2003 FAC Do not delay issuing a revised advisory, but continue to explore a variety of recommendations: Address impact of canned tuna on risk assessment Do more research on mercury levels in species, sub-species and across geographic areas and on consumption patterns and rates Make joint advisory positive (e.g., what you can eat) Make portion size consistent between frequency and variety Clarify portion size Include list of low mercury fish Design advisory to be understood by more than just original target group Include website for those who want more Reconsider what fish should be on the “do not eat list”
 Make portion size consistent between frequency and variety Clarify portion size Include list of low mercury fish Design advisory to be understood by more than just original target group Include website for those who want more Reconsider what fish should be on the do not eat list")
13
Modified Draft Advisory EPA and FDA took the December 2003 FAC recommendations, and revised it: –Made sure that tuna was specifically addressed –Put more emphasis on the benefits of fish consumption and the positive message that there are low mercury fish and eating those types of fish is encouraged –Provided examples of low mercury fish –Addressed the portion size issues –Included website references –Re-considered what fish should be on the “do not eat” list Tested the revised advisory with 8 more focus groups

14
EPA Advisory Methodology Risk based calculation –Consumption rate Mercury content Body weight –Compare to EPA’s Reference Dose –Reference: EPA Fish Advisory Guidance, 2000 Serves as backstop to State advisories –Applies where States have no advice or have not tested for mercury Assumes only fish consumption is local fish (no commercial)
")
15
EPA Advisory Methodology (cont) Data Used –EPA’s Reference Dose (0.0001 mg/kg-day) –6 oz. cooked meal size (from previous advisory and reflective of typical values used by States in their advisories) –70 kg average weight of adult males and females combined in US population –Fish tissue data supplied by States to EPA between 1987 to 2003.
 –70 kg average weight of adult males and females combined in US population –Fish tissue data supplied by States to EPA between 1987 to")
16
EPA Advisory Methodology (cont) More on Fish Tissue Data Used –Dates: 1987 to 2003 –Species: All species used with data from over 100 locations –Sample Type: Fillets only –Data Source: States. Data provided voluntarily to EPA. –Representativeness: Unknown. Data was not randomly collected, and may reflect areas where the States suspected mercury contamination. –Data Repository: National Listing of Fish and Wildlife Advisories, available online at www/epa/gov/ost.

18
EPA Advisory Methodology (cont) Basis of Advisory –Looked at categorizations used by States (e.g., 1 meal/month, 2 meals/week) –Compared categorizations to fish tissue data –Observed most fish fell in 0.12 to 0.32 ppm range, which corresponds to 1 meal/week (EPA, 2000) –Fully uses entire RfD, so advisory recommends no additional fish consumption
 Basis of Advisory –Looked at categorizations used by States (e.g., 1 meal/month, 2 meals/week) –Compared categorizations to fish tissue data –Observed most fish fell in 0.12 to 0.32 ppm range, which corresponds to 1 meal/week (EPA, 2000) –Fully uses entire RfD, so advisory recommends no additional fish consumption")
19
Mercury Fish Consumption Advisories NOTE: This map depicts the presence and type of fish advisories issued by the states for mercury as of December 2002. Because only selected waterbodies are monitored, this map does not reflect the full extent of chemical contamination of fish tissues in each state or province.

20
FDA Exposure Assessment Response to 2002 – FDA Food Advisory recommendation on the 2001 fish advice –Publish a quantitative exposure assessment used to develop the advisory –Develop specific recommendations for canned tuna, based on a detailed analysis of what contribution canned tuna makes to overall methyl mercury levels in women

21
FDA Exposure Assessment (cont) Step 1: estimate of consumption and exposure –Age, sex, body weight. Step 2: estimate of blood and hair levels A probabilistic approach was used throughout

22
Methods MeHg by Species Market share Seafood consumption MeHg Exposure MeHg Blood Levels MeHg Hair Levels Diet-blood ratio Blood-hair ratio

23
Exposure Simulation Short term consumption (3 day) Long-term purchase diaries Market share data Mean Hg (ppm) Shrimp19.6%0.02 Tuna (light)15.7%0.13 Salmon11.1%0.02 Pollock10.3%0.07 Catfish7.6%0.08 Tuna (albacore)6.5%0.32 70.8%
 Long-term purchase diaries Market share data Mean Hg (ppm) Shrimp19.6%0.02 Tuna (light)15.7%0.13 Salmon11.1%0.02 Pollock10.3%0.07 Catfish7.6%0.08 Tuna (albacore)6.5% %")
24
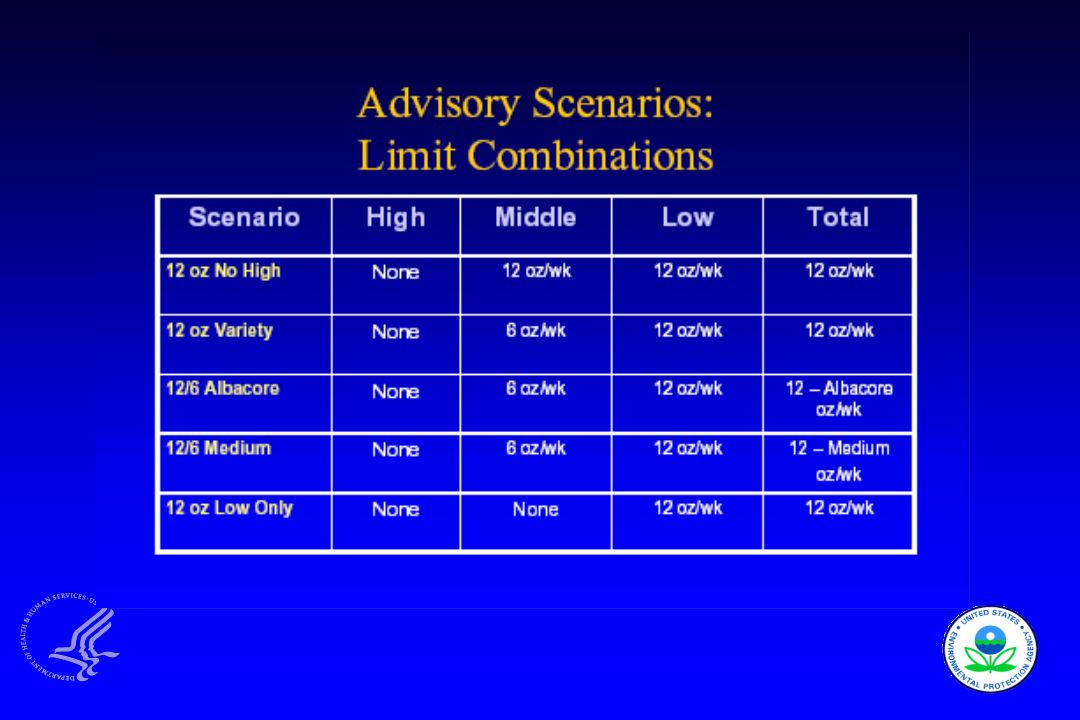
Scenarios Based on the exposure data a number of scenarios were considered For the scenarios fish were divided into high, medium and low MeHg –High: Swordfish, Shark, Tilefish, King Mackerel –Medium: Fish > 0.13 ppm ( e.g. Albacore Tuna, Halibut, Tuna steaks, Rockfish, Haddock, American Lobsters) –Low: Fish < 0.13 ppm (e.g. Light Tuna, Cod, Pollock, Catfish, Shrimp, Salmon, Flatfish, Scallops, Clams, Sardines, Oysters)
 –Low: Fish < 0.13 ppm (e.g. Light Tuna, Cod, Pollock, Catfish, Shrimp, Salmon, Flatfish, Scallops, Clams, Sardines, Oysters).")
25
Peer Review Poster presentation by CD Carrington and PM Bolger, presented at 2003 meeting of the Society of Toxicology (abstract published in The Toxicologist) Published paper describing the exposure model was provided to reviewers –Carrington and Bolger, 2002, An Exposure Assessment for Methylmercury from Seafood for Consumers in the United States, Risk Analysis, 22:689-699.
 Published paper describing the exposure model was provided to reviewers –Carrington and Bolger, 2002, An Exposure Assessment for Methylmercury from Seafood for Consumers in the United States, Risk Analysis, 22:")
26
Result of Peer Review Some changes in response to review –More categories of fish added; new data on [Hg] –Correction for water lost from food preparation –Parameters in consumption frequency chosen to reflect NHANES –Slight increase in number of consumers –Variation in consumer fish choice (changed to individual variable from population variable) –Scenarios changed to reflect limit on amount of fish consumed, type of fish consumed and limits on both –Body weight scaling changed
![Result of Peer Review Some changes in response to review –More categories of fish added; new data on [Hg] –Correction for water lost from food preparation –Parameters in consumption frequency chosen to reflect NHANES –Slight increase in number of consumers –Variation in consumer fish choice (changed to individual variable from population variable) –Scenarios changed to reflect limit on amount of fish consumed, type of fish consumed and limits on both –Body weight scaling changed](http://images.slideplayer.com/24/7560280/slides/slide_26.jpg "Result of Peer Review Some changes in response to review –More categories of fish added; new data on [Hg] –Correction for water lost from food preparation –Parameters in consumption frequency chosen to reflect NHANES –Slight increase in number of consumers –Variation in consumer fish choice (changed to individual variable from population variable) –Scenarios changed to reflect limit on amount of fish consumed, type of fish consumed and limits on both –Body weight scaling changed")
29
Conclusions For women of childbearing age, the model now generates slightly higher values than the NHAMES survey Lowering seafood consumption by either limiting the amount consumed and/or the species consumed can be expected to reduce higher levels of exposure to mercury from seafood consumption in the US population.

Similar presentations


 rolling programme>")


