Download presentation
Presentation is loading. Please wait.

1
Part I - Setting the Context: A Candid View of Our City's Challenges and Opportunities March 16, 2010, 6:30p.m. HEARRR Lecture Series

2
Flawless Execution By: James D. Murphy FUTURE PICTURE STRATEGY LEADER’S INTENT STANDARDS TRAINING PEOPLE THE FLAWLESS EXECUTION ENGINE

3
Part I – Setting the Context: A Candid View of Our City’s Challenges and Opportunities

4
Percentage Families Below Poverty Level

5
The State of Poverty in the City of Rockford Approximately 35,000 people live in poverty 36% of our people in poverty are kids Source: U.S. Census, 2008 American Community Survey The National Average is 19%

6
FERTILITY20062008USIllinois Births in the past 12 months1,6072,313 Unmarried women (widowed, divorced, and never married51.8% 49.1% 34.3%34.2% Per 1,000 women 15 to 19 years old43 75 2927 The State of Poverty in the City of Rockford

7
Approximately 35,000 people live in poverty 36% of our people in poverty are kids Source: U.S. Census, 2008 American Community Survey

8
Food Service Dept: Free/Reduced Apps The State of Poverty in the City of Rockford

9
A Rockford single-parent female who has less than a high school graduate degree lives 81.4% below the poverty level. Married-couple families with less than a high school graduate live 14.4% below the poverty level. A Rockford single-parent female who has a high school degree or equivalency improves her family’s chances dramatically, living 44.6% below the poverty level. Married couple families with similar education live at 10.6% below the poverty level. Some college or an associate’s degree? 13.2% Married couple families improve to 0% below poverty level. Bachelor’s degree or higher, and single-parent females are statistically at 0% below poverty level. Married couple families see no change in poverty level. The State of Poverty in the City of Rockford

10
Labor Force & Employment Trends

11
2008USIllinois DISABILITY STATUS15.2%12.1%10.3% 22,908 people have disability status in the City of Rockford The State of Poverty in the City of Rockford

12
City Public Housing Authority Density

13
Low Income Housing Distribution

14
Disorder Map

15
Annexation History

16
Disorder Map

17
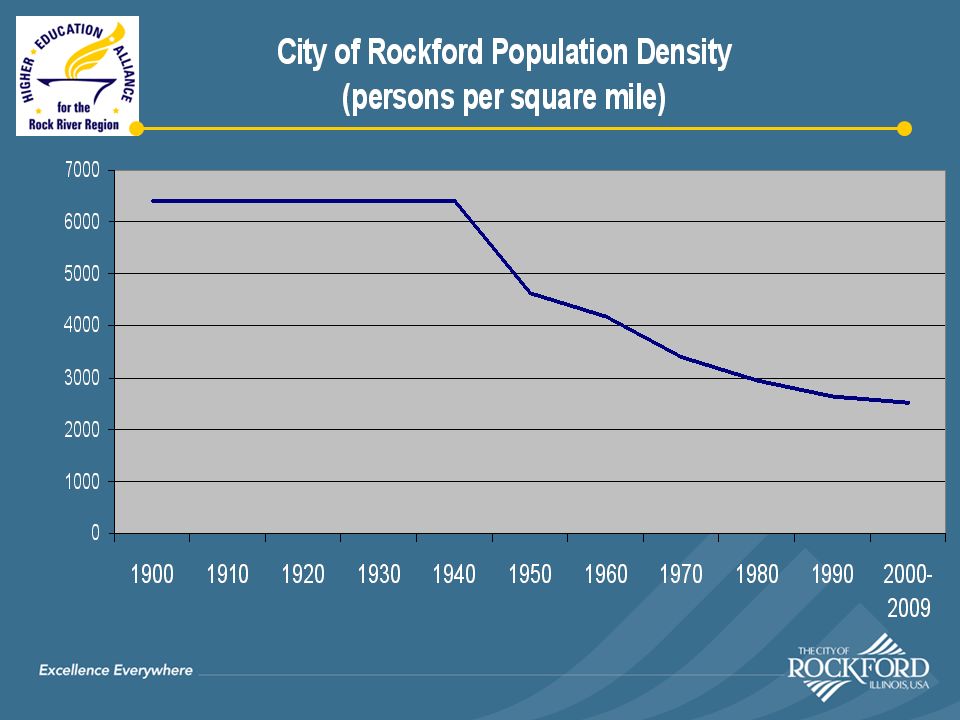
Urban Sprawl

19
Cost of Sprawl: High Crime Rate City Crime Rate per 1000 Crime Rate per 1000 Rank (Hi to Lo) Land Area (Sq. Mi.)Population Density Population Density Rank (Lo to Hi) Springfield83081542,1422 Rockford8109261.812,4744 Peoria6773344.42,5383 Decatur5910441.561,8731 Chicago58215227.1312,51516 Champaign4545616.994,21212 Schaumburg44527193,8328 Evanston423587.759,70815 Bloomington3569922.53,3325 Aurora35521038.534,36513 Joliet33751138.063,8317 Cicero3278125.8514,14417 Elgin306313253,9469 Waukegan27301423.13,95710 Bolingbrook21241520.513,4356 Naperville20151635.384,00211 Arlington Heights19391716.414,68914
Population Density Population Density Rank (Lo to Hi) Springfield ,1422 Rockford ,4744 Peoria ,5383 Decatur ,8731 Chicago ,51516 Champaign ,21212 Schaumburg ,8328 Evanston ,70815 Bloomington ,3325 Aurora ,36513 Joliet ,8317 Cicero ,14417 Elgin ,9469 Waukegan ,95710 Bolingbrook ,4356 Naperville ,00211 Arlington Heights ,")
20
Cost of Sprawl: High Property Tax Rate 2006 Rate2006 Rank Property Tax Overall Ranking9.278th Residential9.1512th Farm8.0926th Commercial9.738th Industrial9.619th

21
LRTP – Population Projections

22
TRANSPORTATION / LAND USE INTERRELATIONSHIP

23
TITLE VI CIVIL RIGHTS ENVIRONMENTAL JUSTICE

24
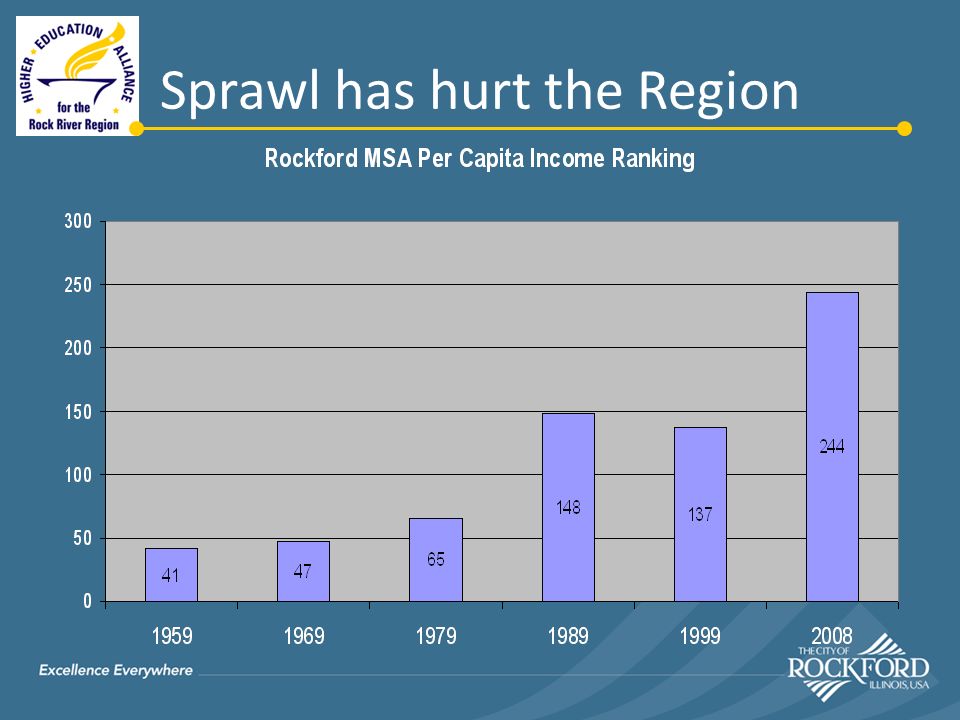
Sprawl has hurt the Region

26
Current State of Job Market CITIES September 2009 EAST ST. LOUIS17.6 ROCKFORD17.2 NORTH CHICAGO16.7 KANKAKEE16.6 MAYWOOD VILLAGE15.4 HARVEY15.4 CHICAGO HEIGHTS15.3 BELVIDERE15 CALUMET14.1 DOLTON14 CITIES September 2009 September 2008 Annual Change PEKIN13.76.57.2 ROCKFORD17.210.36.9 BELVIDERE159.15.9 PEORIA12.26.45.8 MAYWOOD15.49.85.6 DECATUR13.78.25.5 FREEPORT13.585.5 CHICAGO HEIGHTS15.39.95.4 ELGIN12.26.95.3 JOLIET12.27.15.1 LARGEST CITY UNEMPLOYMENT RATELARGEST UNEMPLOYMENT RATE ANNUAL INCREASE No other city in the State of Illinois has suffered in 2009 in terms of high unemployment and annual job loss than Rockford.

27
Where are the cities with low unemployment and low annual job loss? CITIES September 2009 CARBONDALE6.3 WILMETTE6.3 NORTHBROOK6.7 HIGHLAND PARK6.8 NORMAL6.9 GLENVIEW7 GLEN ELLYN7.4 EVANSTON7.6 PARK RIDGE7.6 WHEATON7.6 CITIES September 2009 September 2008 Annual Change CARBONDALE6.35.31 NORMAL6.95.31.6 SPRINGFIELD8.26.41.8 HIGHLAND PARK6.84.91.9 WILMETTE6.34.22.1 O'FALLON85.82.2 URBANA8.262.2 NORTHBROOK6.74.42.3 CHAMPAIGN8.15.72.4 GLENVIEW74.42.6 LOWEST CITY UNEMPLOYMENT RATE LOWEST UNEMPLOYMENT RATE ANNUAL INCREASE

28
CITIES September 2009 Unemployment Rank Annual Change from 2008 Annual Change Rank Variance between Unemployment Rank and Annual ChangeHigher Education Opportunities CARBONDALE6.31110Southern Illinois University, John A. Logan College HIGHLAND PARK6.841.940 College of Lake County, Keller Graduate School of Management, University of Illinois at Chicago, Music Arts School, a campus of The Music Institute of Chicago WILMETTE6.322.154.5 National-Louis University,School of Art Institute of Chicago, Northwestern University, and Northeastern Illinois University NORMAL6.951.624.5 Heartland Community College, Illinois Wesleyan University, Lincoln College, Illinois State University GLENVIEW762.6108 Oakton Community College, Rinity University, National-Louis University EVANSTON7.682.7128 Northwestern University, Oakton Community College, National-Louis University PARK RIDGE7.692.7138 Oakton Community College, Triton College, Northeastern Illinois University NORTHBROOK6.732.3812.5Trinity International University, Oakton Community College WHEATON7.6103.11832 Wheaton College, Benedictine University, North Central College, College of DuPage, Devry Institute of Technology CHAMPAIGN8.1192.4950University of Illinois, Parkland College, College of Fine & Applied Arts O'FALLON8182.2672 William Jewell College, University of Illinois at Chicago, Westwood College, Southwestern Illinois College, and Southern Illinois-Edwardsville and Scott Air Force Base GLEN ELLYN7.473.22198 College of DuPage, Devry Institute of Technology, Elmhurst College, Illinois Benedictine, Illinois Institute of Technology, National University of Health Sciences, National-Louis University, North Central College, Robert Morris College, Universal Technical Institute, and Wheaton College URBANA8.2212.2798 University of Illinois, University of Illinois College of Medicine, Parkland College SPRINGFIELD8.2201.83144.5 Springfield Technical Community College, Springfield College, University of Illinois Springfield, Southern Illinois School of Medicine, Lincoln Land Community College, Robert Morris College. State Capitol What do these cities have in common? Cities that host State of Illinois Higher Education Facilities Cities that are within 15 minutes of a State of Illinois Higher Education Facility and that host top tier private colleges.

29
EDUCATIONAL ATTAINMENT 20062008USIllinois Population 25 years and over97,708103,134 Less than 9th grade8.2%9.5%6.4%6.40% 9th to 12th grade, no diploma13.7%14.2%8.7%7.70% High school graduate (includes equivalency)33.6%32.9%28.5%27.30% Some college, no degree16.9%18.9%21.3%21.40% Associate's degree9.8%5.9%7.5%7.30% Bachelor's degree11.3%11.4%17.5%18.60% Graduate or professional degree6.6%7.2%10.2%11.20% Percent high school graduate or higher78.1%76.3%85.0%85.90% Percent bachelor's degree or higher17.8%18.6%27.7%29.90% The State of Educational Attainment in the City of Rockford
33.6%32.9%28.5%27.30% Some college, no degree16.9%18.9%21.3%21.40% Associate s degree9.8%5.9%7.5%7.30% Bachelor s degree11.3%11.4%17.5%18.60% Graduate or professional degree6.6%7.2%10.2%11.20% Percent high school graduate or higher78.1%76.3%85.0%85.90% Percent bachelor s degree or higher17.8%18.6%27.7%29.90% The State of Educational Attainment in the City of Rockford")
30
To Achieve Parity with the National Average Among 18 – 24 year old residents: About 960 more people without a high school degree must earn a GED About 1,700 more people with only a high school degree must experience “some college” About 930 more people must earn at least a bachelor’s degree – That’s about 10% of the group who already reports “some college” Source: NIU Center for Governmental Studies

31
To Achieve Parity with the National Average Among 25 – 34 year old residents: About 720 more people without a high school degree must earn a GED About 143 more people with only a high school degree must experience “some college” About 4,550 more people must earn at least a bachelor’s degree – That’s about 50% of the group who already reports “some college” Source: NIU Center for Governmental Studies

32
To Achieve Parity with the National Average Among 35 – 44 year old residents: About 550 more people without a high school degree must earn a GED About 4,420 more people must earn at least a bachelor’s degree – That’s about 40% of the group who already reports “some college” Source: NIU Center for Governmental Studies

33
“The Five Dysfunctions of a Team” by Patrick Lencioni Inattention to Results Avoidance of Accountability Lack of Commitment Fear of Conflict Absence of Trust

Similar presentations


 Age 18-24 Age 25-64 Speak English Poorly or Not at All – Age 18 to 64 (%) High.>")

 June 2009.>")


 Age 18-24 Age 25-64 Speak English Poorly or Not at All – Age 18 to 64 (%) High.>")
 Age 18-24 Age 25-64 Speak English Poorly or Not at All – Age 18 to 64 (%) High.>")


