Download presentation
Presentation is loading. Please wait.

1
SLWK – 609 Research Methods- online- M. Secret Podcast 5 BASIC CONCEPTS OF RESEARCH DESIGN http://www.screencast.com/t/3SYNmut6D7y

3
Research designs and causality Research design means ….. the plan of collecting the data the way an investigator conducts a study the procedures employed to answer the research problem or question methods and time of data collection the circumstances of the research setting.

4
Certain plans or designs help us to determine causality better than other plans or designs Think of a continuum.. Not “either” “or”..

5
Nomothetic vs Idiographic Nomothetic.. Associated with quantitative research methods… cause and effect determined by an experimental research design that examines relationship between independent and dependent variable Idiographic.. Associated with qualitative research methods.. Cause and effect discussed in narrative form..based on qualitative data gathered and context

6
WHAT IS CAUSALITY or the CAUSAL EFFECT When the variation in one variable is related to the variation in another variable When change in independent variable is responsible for change in the dependent variable. Idiographic researchers talk about Sequence of events rather than variables..

7
THREE CRITERIA NEEDED TO DETERMINE CAUSALITY 1. Statistical Relationship /association between the two variables– as one variable changes, so does another variable 2. Time order -- independent variable occurs before dependent variable 3. Relationship must not be spurious (i.e no confounding variable).. Nothing other than the independent variable creates the change Language of quantitative research.. monethetic
.. Nothing other than the independent variable creates the change Language of quantitative research.. monethetic.")
8
Define ‘spurious’ FFalse BBogus FFake sspu ⋅ ri ⋅ ous* ˈ spy ʊ ər i əs/ [spyoo r-ee-uh s] –adjective 1.not genuine, authentic, or true; not from the claimed, pretended, or proper source; counterfeit.; bastard. *http://dictionary.reference.com/browse/spurious
![Define ‘spurious’ FFalse BBogus FFake sspu ⋅ ri ⋅ ous* ˈ spy ʊ ər i əs/ [spyoo r-ee-uh s] –adjective 1.not genuine, authentic, or true; not from the claimed, pretended, or proper source; counterfeit.; bastard.](http://images.slideplayer.com/24/7540318/slides/slide_8.jpg "*")
9
Experimental vs non-experimental designs experimental designs – Best to determine cause and effect Address all three criteria for causality Used for explanatory/evaluative purposes Data often collected at two points in time (pre-post) non-experimental designs – Frequently only demonstrate association, not causality Often cannot demonstrate time order or non-spuriousness Used for descriptive/exploratory purposes Data often collected at ONE point in time
 non-experimental designs – Frequently only demonstrate association, not causality Often cannot demonstrate time order or non-spuriousness Used for descriptive/exploratory purposes Data often collected at ONE point in time")
10
What is a true (classical) experimental design PROCEDURE Divide study participants into two groups One group gets the treatment or the experiment The other doesn’t.. If after the treatment, there is a difference in results between the two groups, then can make some reasonable conclusion that the treatment caused the result DISTINGUISHING CHARACTERISTICS True randomization... every individual in the study has an equal chance of being in either the control or the experimental group.... attempts to insure is that there are no differences in the subjects of the groups which could account for change except for the intervention which was different for each group. Manipulation the individual variable.. Gives intervention to experimental group and withholds from non-experimental (control) group In the study setting, researcher controls of as many factors as possible that could influence the situation so that again you can be assured, or mostly assured, that the intervention is the cause of the change
 group In the study setting, researcher controls of as many factors as possible that could influence the situation so that again you can be assured, or mostly assured, that the intervention is the cause of the change.")
11
How does an experimental study meet criteria for causality Association/relationship Dependent variable = stress Independent variable = medication.. Give experimental group medication and control group no medication If experimental group has decrease in stress and control group does not, then there is a relationship.. Change in dependent variable (decrease in stress) is related to change in independent variable (medication, yes or no)
 is related to change in independent variable (medication, yes or no).")
12
ASSOCIATION/RELATIONSHIP No medication Yes medication No decrease in stress Decrease in stress

13
How does an experimental study meet criteria for causality Time order Need to be sure that medication comes before the decrease in stress Administer intervention.. Give medication Measure stress of both groups AFTER medication

14
Time order and association No medication Yes medication No decrease in stress Decrease in stress Independent variable = medication Comes BEFORE decrease in stress Dependent variable = decrease in stress comes AFTER medication

15
How does an experimental study meet criteria for causality … non-spuriousness Random assignment means that the two groups are equal on all important characteristics.. Control for spuriousness because no variation between the groups on any variable other than the independent variable being tested The only concept that varies is the independent variable.. Others (age, race, gender, IQ, income, social support, employment status are the same)
.")
16
INTERVENING VARIABLES -- Mediating and Moderating Variables Mediating -- some other variable comes between the independent and dependent variable.. A ‘third’ variable alters the relationship between the independent and dependent variable Moderating – the relationship between the independent and dependent variable occurs only in some situations/circumstances

17
What are possible Mediating variables.. No medication Yes medication No decrease in stress Decrease in stress Medication adherence Other medications taken

18
Moderating variable Works only for people over the age of 35Does not work for children or teens Moderating variable = age group

19
Gap in the Research What is the relationship between medication and stress in young adults – 19 -35

20
Thinking about your project – CLG work If you are doing a quantitative study.. Identify possible intervening variables in your project

21
Longitudinal research design: Data are collected at two or more points in time. Sometimes can be a quasi-experimental design

22
Trend = data at two or more points in time from different samples of same population Panel design = gather data from same sample at different points in time Cohort study = can be either trend or panel. Have to be those who experienced similar event.

23
Unit of analysis vs sampling unit What is a unit of analysis? the level of social life on which the research question is focused, such as individuals, groups, towns, or nations How is it different from a sampling unit? the level of social life on which data is collected such as individuals, groups, towns, or nations

24
Errors in Causal Reasoning Ecological Fallacy and Reductionist Fallacy: information collected from one unit of analysis is applied to another unit.. Ex: I collect information from managers in social service organizations about turnover rates in that organization and generalize to the social service employees RATHER than social service organizations. If a particular sports team is described as performing poorly, it would be fallacious to conclude that each player on that team performs poorly ( ex from Wikipediahttp://en.wikipedia.org/wiki/Ecological_fallacy)
.")
25
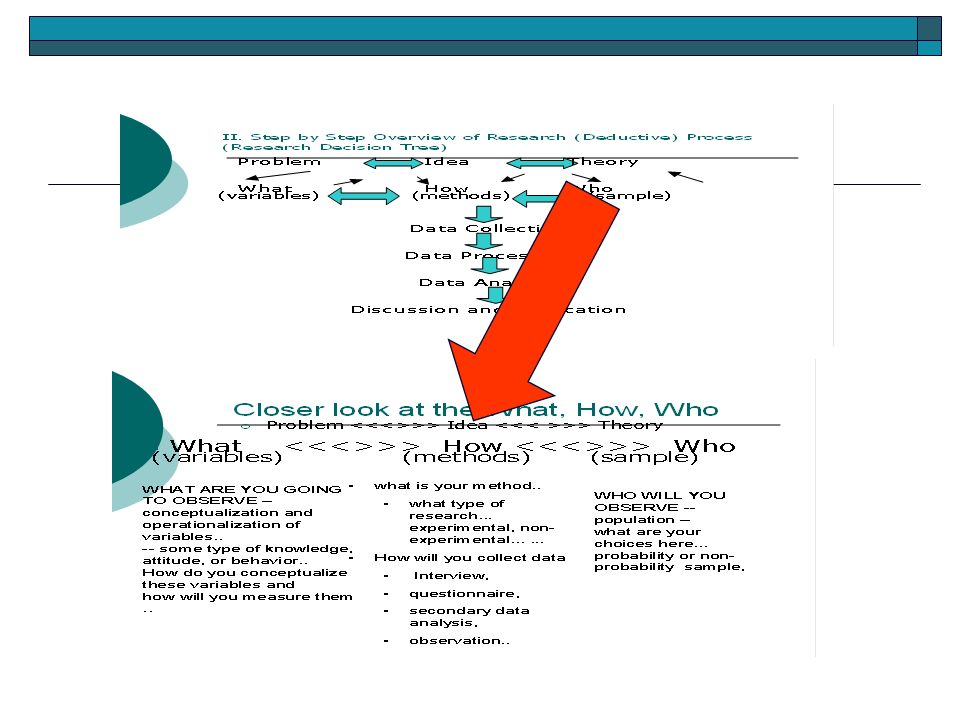
Validity Considerations – fill in the blank?? What > How > Who (variables) (methods) (sample) ________ Validity ______ validity ________ validity Measurement Causal Generalizability (external
 (methods) (sample) ________ Validity ______ validity ________ validity Measurement Causal Generalizability (external.")
Similar presentations