Download presentation
Presentation is loading. Please wait.

1
Quasi-Experimental Designs

2
Quasi-Experimental Designs
Intermediate between correlational study and true experiment. More than a relationship between variables. Low internal validity = cannot determine causality. In true experiment, IV is manipulated and subjects are randomly assigned to conditions. In quasi-experiments, IV is “manipulated”, but subjects are already part of a group based on pre-existing characteristics.

3
Nonmanipulated IV IV occurs naturally
Participants are not randomly assigned to conditions. Compares performance between 2 or more groups based on pre-existing characteristics. Ex: gender; religion; age; smokers vs. nonsmokers; high, medium or low cholesterol levels. Groups are not equivalent before treatment. Low internal validity – we cannot conclude causality Nonmanipulated independent variable and measure a particular dependent variable. Because the IV is not directly manipulated, the internal validity of quasi-experimental designs is always threatened. We can never conclude that the IV definitely caused changes in the DV. Results may be confounded. Internal validity – extent to which we can infer that the results on the DV are a direct cause of the manipulation of the IV.

4
Control group & Nonequivalent group
True experimental designs have an experimental group (treatment) and a control group (no treatment). Participants are randomly assigned to either condition. Quasi-experimental designs do not have a control group because there is no random assignment of participants to the conditions. The nonequivalent group serves as the comparison to the treatment group
 and a control group (no treatment). Participants are randomly assigned to either condition. Quasi-experimental designs do not have a control group because there is no random assignment of participants to the conditions. The nonequivalent group serves as the comparison to the treatment group.")
5
Typical quasi-experimental design
Select 2 groups based on pre-existing characteristics. Divide each group in half: half of the participants in each group get the treatment and half do not. Compare performance with and without IV within each group and across groups. Disadvantage Pre-existing differences can confound results.

6
Nonequivalent group design
Age Males Females 11 15 18 28 Yes NO Caffeine DV: # of anagrams solved

7
Nonequivalent group design
Age Young Old 88 86 60 42 Recall Recognition Memory Test DV: % of words remembered

8
Single-Case Experimental Designs

9
Single case experimental designs
Involves the study of only 1 participant (single case designs) or 2 or 3 participants (small- n designs) Often used in clinical settings. Do not allow for generalization. Allow for replications with different IV on the same participant or small-n designs. Do not compare means nor run statistical analyses. Assess how performance changes from one condition to another by graphing it. Similar to experiments were we manipulate IV and measure a DV. The only differences is that here, only 1 participant is being studied at a time. Ebbinghaus and the learning curve and forgetting curve. As statistical procedures were developed, like Analysis of Variance and t-tests, more scientists had means to study large groups of subjects using inferential statistics.
 or 2 or 3 participants (small- n designs) Often used in clinical settings. Do not allow for generalization. Allow for replications with different IV on the same participant or small-n designs. Do not compare means nor run statistical analyses. Assess how performance changes from one condition to another by graphing it. Similar to experiments were we manipulate IV and measure a DV. The only differences is that here, only 1 participant is being studied at a time. Ebbinghaus and the learning curve and forgetting curve. As statistical procedures were developed, like Analysis of Variance and t-tests, more scientists had means to study large groups of subjects using inferential statistics.")
10
Baseline measurement A measurement of behavior made under normal conditions (e.g., no IV is present); a control condition. Serves to compare the behavior as affected by the IV. Collect enough measures to achieve a stable pattern.

11
Representative Single-Case Experimental Designs
Reversal Designs IV is introduced and removed one or more times. 1) A-B design - simplest of all designs - measure baseline behavior, apply treatment and compare behavior after treatment to baseline. - does not allow to establish cause-effect A-B design Ex: your dog keeps barking in the backyard while you are trying to watch a movie. You go up to the window and observe your dog under normal conditions for a 5 minutes and you notice he is simply barking up at the air. You go out there and give the dog a toy. The dog stops barking. Baseline- barking Treatment – giving a toy Result: barking behavior decreased in treatment condition compared to baseline condition. Why do you think we are not able to establish causality with this design?
 A-B design. - simplest of all designs. - measure baseline behavior, apply treatment and compare behavior after treatment to baseline. - does not allow to establish cause-effect. A-B design. Ex: your dog keeps barking in the backyard while you are trying to watch a movie. You go up to the window and observe your dog under normal conditions for a 5 minutes and you notice he is simply barking up at the air. You go out there and give the dog a toy. The dog stops barking. Baseline- barking. Treatment – giving a toy. Result: barking behavior decreased in treatment condition compared to baseline condition. Why do you think we are not able to establish causality with this design")
12
A-B design treatment Behavior during/ after treatment
Behavior at Baseline

13
A-B-A design Baseline measurement Apply treatment
Measure change in behavior (posttest 1) Remove treatment Behavior “should” go back to baseline (final assessment) If a change in behavior during B is actually due to the experimental treatment, the change should disappear when B is removed and you return to the baseline condition. If, on the other hand, a change in B was due to some extraneous variable, the change will not disappear when treatment is removed. Thus, the A-B-A design allows a causal relation to be drawn. What are the drawbacks to a A-B-A design? If you end your experiment on an A phase, this leaves the participant “hanging” without the treatment.
 Remove treatment. Behavior should go back to baseline. (final assessment) If a change in behavior during B is actually due to the experimental treatment, the change should disappear when B is removed and you return to the baseline condition. If, on the other hand, a change in B was due to some extraneous variable, the change will not disappear when treatment is removed. Thus, the A-B-A design allows a causal relation to be drawn. What are the drawbacks to a A-B-A design If you end your experiment on an A phase, this leaves the participant hanging without the treatment.")
14
A-B-A design treatment Behavior with treatment Behavior at Baseline
Remove treatment Behavior back to Baseline

15
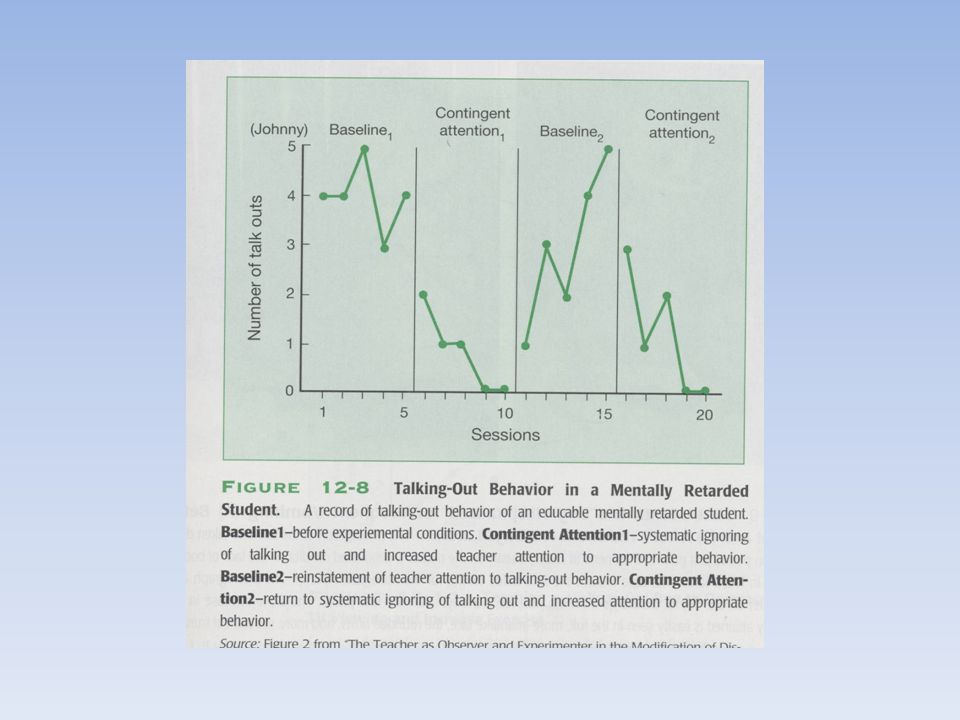
A-B-A-B design Baseline measurement Apply treatment
Measure change in behavior (posttest 1) Remove treatment Behavior “should” go back to baseline (assessment) Apply treatment again Measure change in behavior (posttest 2) More ethical to end with treatment. design gives two transitions (B to A and A to B) that can demonstrate the effect of the treatment variable. Thus, our ability to draw a cause-and-effect conclusion is further strengthened. A-B-A-B design is the preferred design for single-case research. Sometimes, not ethical to return subject to baseline in order to determine causality more ethical to use A-B than A-B-A-B design Ex: lots of accident at one corner of the street. town officials put a Stop sign at corner # of accidents decreases tremendously Is it ethical to remove the Stop sign (A-B-A design) to see if this was really the “cause” of decrease in accidents?
 Remove treatment. Behavior should go back to baseline (assessment) Apply treatment again. Measure change in behavior (posttest 2) More ethical to end with treatment. design gives two transitions (B to A and A to B) that can demonstrate the effect of the treatment variable. Thus, our ability to draw a cause-and-effect conclusion is further strengthened. A-B-A-B design is the preferred design for single-case research. Sometimes, not ethical to return subject to baseline in order to determine causality. more ethical to use A-B than A-B-A-B design. Ex: lots of accident at one corner of the street. town officials put a Stop sign at corner. # of accidents decreases tremendously. Is it ethical to remove the Stop sign (A-B-A design) to see if this was really the cause of decrease in accidents")
16
A-B-A-B design Remove treatment treatment Behavior at Baseline
Behavior with treatment treatment Behavior with treatment Behavior back to Baseline

18
Multiple-Baseline Designs
Effects of IV are assessed across several participants, behaviors and situations. Control for confounds by introducing treatment at different times for different participants, behaviors and situations.

19
Multiple-baseline designs
Multiple-baseline across participants Determine who has most stable baseline and introduce treatment to that subject first. Multiple-baseline across behaviors Determine most stable behavior and start with treatment on that behavior and then start on 2nd behavior. Multiple-baseline across situations Determine when behavior is occurring and tackle one situation at a time. Ask class for examples of each condition.

Similar presentations


: 71.6(11.6)% Range: 44-95% Appointment Research day 1 week.>")
 w Interpreted.>")


 Design –Different subjects are assigned to each level of the IV.>")

 e.g., behavior.>")


