Download presentation
Presentation is loading. Please wait.

1
Bivariate Distributions Overview

2
I. Exploring Data Describing patterns and departures from patterns (20%-30%) Exploring analysis of data makes use of graphical and numerical techniques to study patterns and departures from patterns. Emphasis should be placed on interpreting information from graphical and numerical displays and summaries.
 Exploring analysis of data makes use of graphical and numerical techniques to study patterns and departures from patterns. Emphasis should be placed on interpreting information from graphical and numerical displays and summaries..")
3
I. Exploring Data

4
What should you discuss when describing a bivariate relationship?

5
I. Exploring Data What should you discuss when describing a bivariate relationship? 1. Describe the cases and variables.

6
I. Exploring Data What should you discuss when describing a bivariate relationship? 1.Describe the cases and variables. 2.Describe the shape (linear or curved).
..")
7
I. Exploring Data What should you discuss when describing a bivariate relationship? 1.Describe the cases and variables. 2.Describe the shape (linear or curved). 3.Describe the trend (positive or negative, in context).
. 3.Describe the trend (positive or negative, in context)..")
8
I. Exploring Data What should you discuss when describing a bivariate relationship? 1.Describe the cases and variables. 2.Describe the shape (linear or curved). 3.Describe the trend (positive or negative, in context – Least squares line). 4.Describe the strength (moderate, weak, strong – r and r 2 ). 5.Does the relationship generalize? (to other cases, other times) 6.Suggest possible reasons for the relationship.
. 3.Describe the trend (positive or negative, in context – Least squares line). 4.Describe the strength (moderate, weak, strong – r and r 2 ). 5.Does the relationship generalize. (to other cases, other times) 6.Suggest possible reasons for the relationship..")
9
What is r? r is Pearson’s correlation coefficient. It is a measure of strength of linear association. Once we’ve determined from a graph that the relationship is linear, we can use r to describe the strength of the relationship.

10
What is r?

11
r is calculated by converting the x and y coordinates to z-scores, then finding the product for each point. The average (almost) product of the z-scores for each point is r.
 product of the z-scores for each point is r..")
12
What is r 2 ? This is a plot of the number of calories per 5 oz. serving of pizza and the number of grams of fat per serving.

13
What is r 2 ? Our best estimate for the typical number of calories in a serving of pizza would be to use the mean number of calories.

14
What is r 2 ? Of course there is error in this estimate. When we calculate the typical error (standard deviation) we square the amount of error.
 we square the amount of error..")
15
What is r 2 ? The total amount of squared error is called the Total Sum of Squares (SST).
.")
16
What is r 2 ? But if we use information about the amount of fat, we can create a regression line to minimize this squared error.

17
What is r 2 ? The sum of the squared error from the regression line is called the Sum of Squared Error (SSE).
..")
18
What is r 2 ? Notice the amount of squared error reduced substantially. It dropped from 24490 to 4307. We can calculate the amount of error that was ‘explained’ by the regression line. This is r 2. 82% of the variation in calories can be explained by using the regression equation with fat as a predictor.

19
Multiple Choice Questions Read and think for one minute, and write your answer. Discuss with group members for 30 seconds and decide on a final answer. Discuss as a group for as long as we need to...

20
Source: AP Practice Exam

22
Answer: A

23
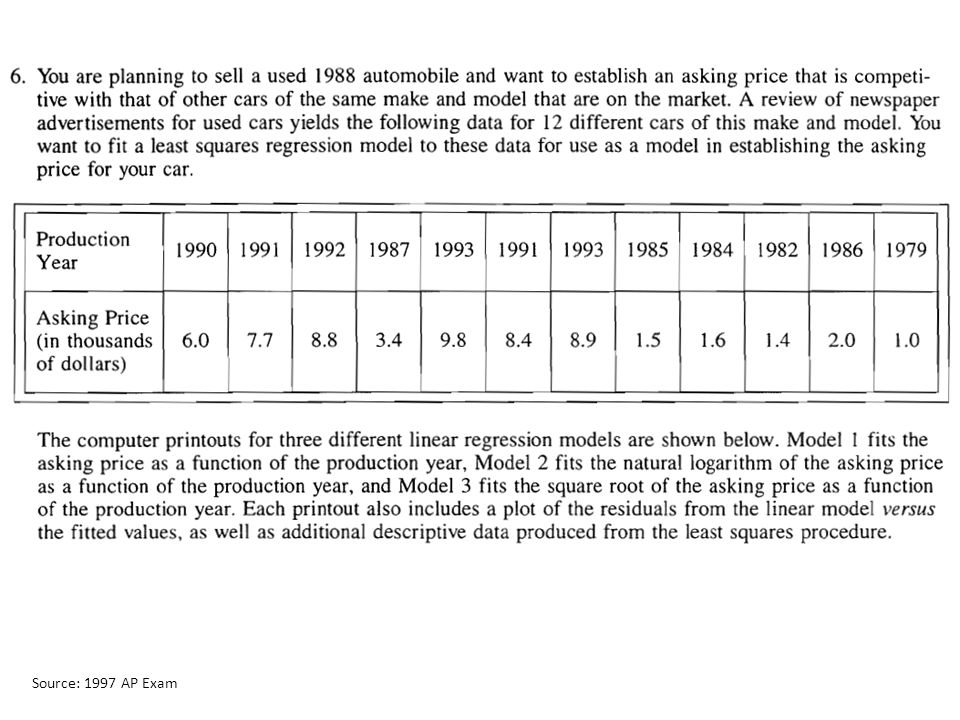
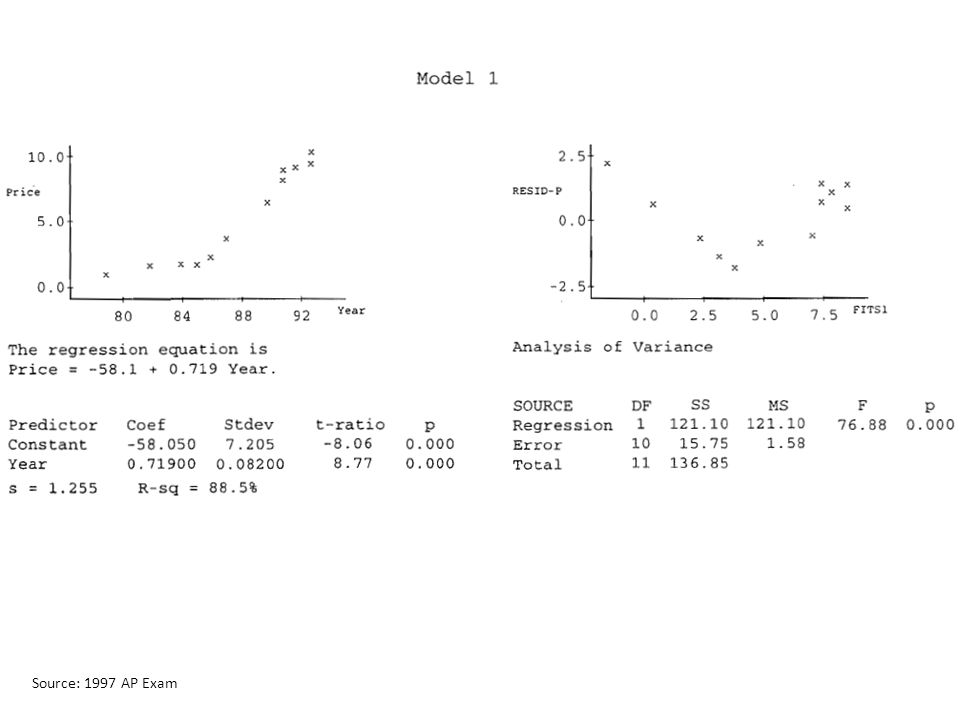
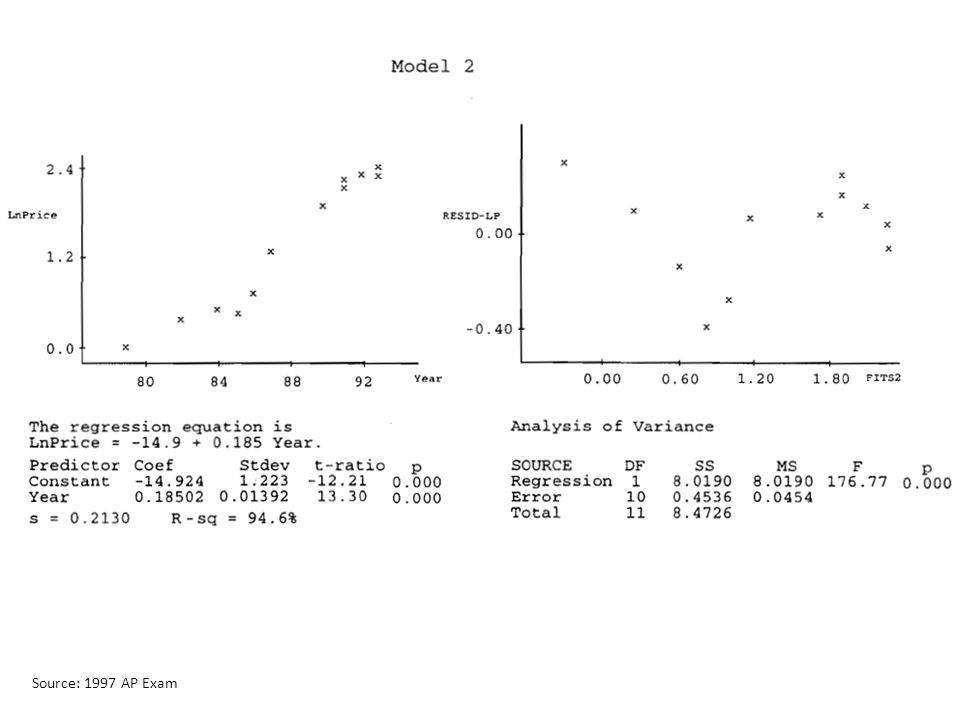
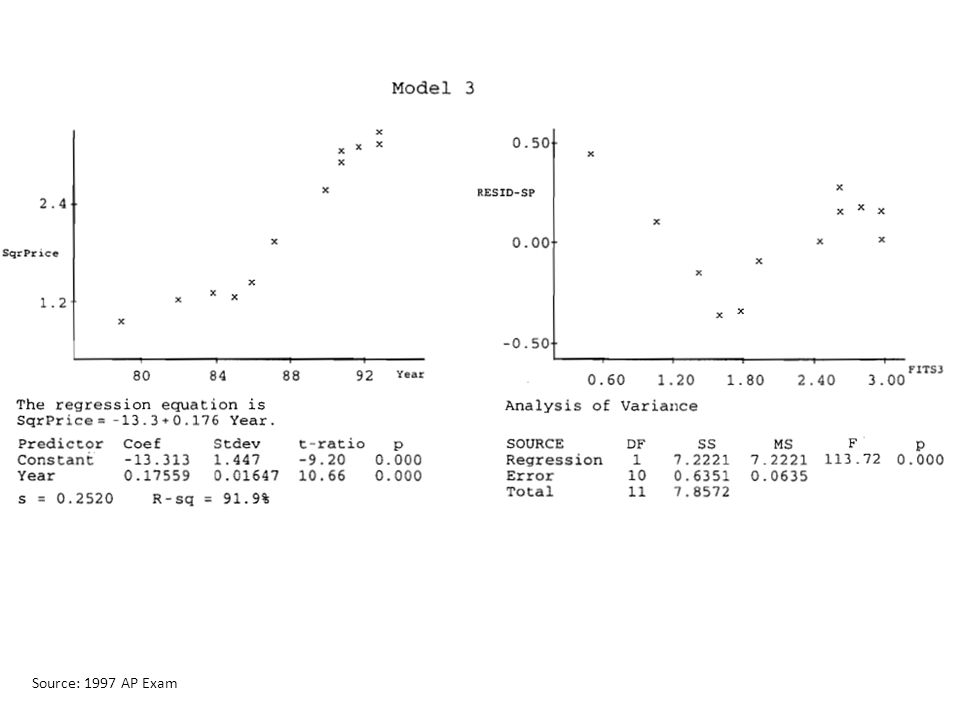
Source: 1997 AP Exam

24
Answer: B

25
Source: AP Practice Exam

26
Answer: A

27
Source: 1997 AP Exam

28
Answer: A

31
Source: AP Practice Exam

35
Source: 1997 AP Exam

42
Source: 2011 AP Exam

Similar presentations