Download presentation
Presentation is loading. Please wait.

1
Mapping populations Controlled crosses between two parents –two alleles/locus, gene frequencies = 0.5 –gametic phase disequilibrium is due to linkage, not other causes Examples –Backcross (BC 1 or BC 2 ) –F 2 or F 2:3 –Recombinant inbred lines (RIL) –Doubled haploid (DH)
 –F 2 or F 2:3 –Recombinant inbred lines (RIL) –Doubled haploid (DH)")
2
Recombinant Inbred Lines (RILs)
")
4
GenerationAAAaaa F10100%0 F225%50%25% F337.5%25%37.5% F443.75%12.5%43.75% F546.875%6.25%46.875% F648.4375%3.125%48.4375% F1049.9%0.2%49.9% A (1/2) a (1/2) A (1/2) AA (1/4) Aa (1/4) a (1/2) aA (1/4) Aa (1/4) ♀ ♂
 a (1/2) A (1/2) AA (1/4) Aa (1/4) a (1/2) aA (1/4) Aa (1/4) ♀ ♂")
5
expected frequency r = 0r = 0.5 0.50.25 0.00.25 0.00.25 0.50.25 Recombinant Inbred Lines (RILs)
")
6
R R R R RILs

7
Doubled Haploids

8
expected frequency r = 0r = 0.5 0.50.25 0.00.25 0.00.25 0.50.25 Doubled Haploids (DHs)
")
9
DOUBLED HAPLOIDS RR R R RR R R R R

10
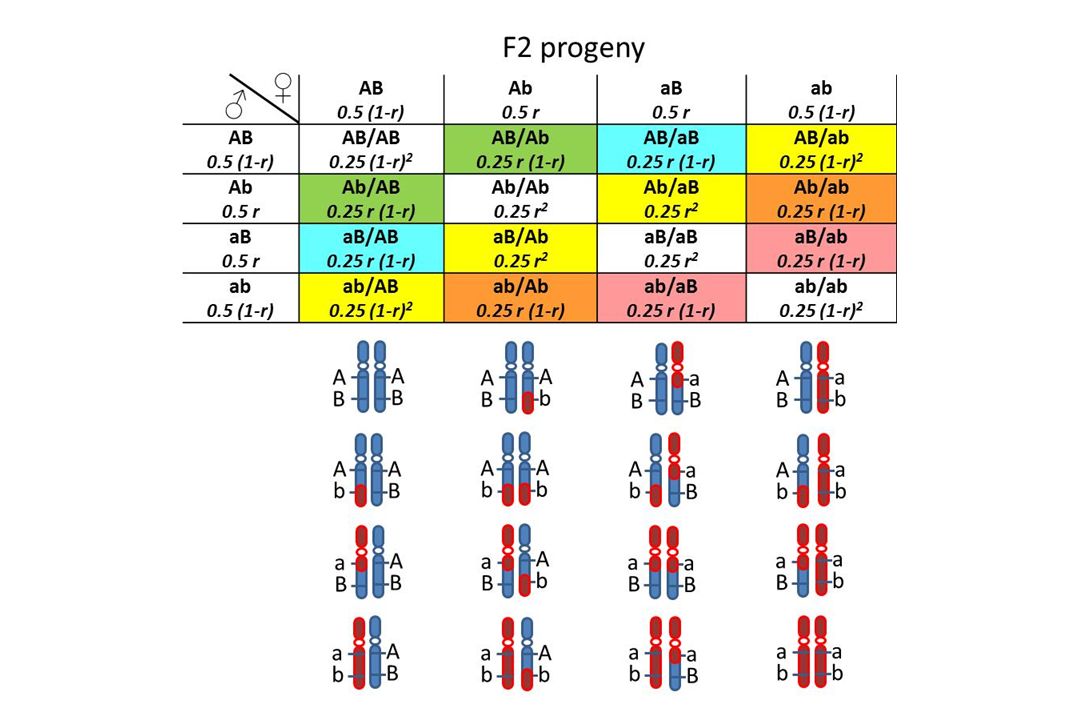
F2 Population

12
Expected Genotypic Frequencies for F 2 Progeny when r = 0 or r = 0.5 Between Two Loci in Coupling (AB/ab) Configuration GenotypeExpected Frequency r = 0r = 0.5 AB/ABp 1 = 0.25(1 - r) 2 1/4 = 0.251/16 = 0.0625 AB/aBp 2 = 0.50r(1 - r) 0.02/16 = 0.125 AB/Abp 3 = 0.50r(1 - r) 0.02/16 = 0.125 AB/abp 4 = 0.50(1 - r) 2 1/2 = 0.52/16 = 0.125 Ab/aBp 5 = 0.50r 2 0.02/16 = 0.125 Ab/Abp 6 = 0.25r 2 0.01/16 = 0.0625 Ab/abp 7 = 0.50r(1 - r) 0.02/16 = 0.125 aB/aBp 8 = 0.25r 2 0.01/16 = 0.0625 aB/abp 9 = 0.50r(1 - r) 0.02/16 = 0.125 ab/abp 10 = 0.25(1 - r) 2 1/4 = 0.251/16 = 0.0625
 Configuration GenotypeExpected Frequency r = 0r = 0.5 AB/ABp 1 = 0.25(1 - r) 2 1/4 = 0.251/16 = AB/aBp 2 = 0.50r(1 - r) 0.02/16 = AB/Abp 3 = 0.50r(1 - r) 0.02/16 = AB/abp 4 = 0.50(1 - r) 2 1/2 = 0.52/16 = Ab/aBp 5 = 0.50r /16 = Ab/Abp 6 = 0.25r /16 = Ab/abp 7 = 0.50r(1 - r) 0.02/16 = aB/aBp 8 = 0.25r /16 = aB/abp 9 = 0.50r(1 - r) 0.02/16 = ab/abp 10 = 0.25(1 - r) 2 1/4 = 0.251/16 =")
13
Expected and Observed Genotypic Frequencies Coupling (AB/ab) and Repulsion (Ab/aB) F 2 Progeny GenotypeObserved Frequency CouplingRepulsion AB/ABp1p1 p 1 = 0.25(1 - r) 2 p 1 = 0.25r 2 AB/aBp2p2 p 2 = 0.50r(1 - r) AB/Abp3p3 p 3 = 0.50r(1 - r) AB/abp4p4 p 4 = 0.50(1 - r) 2 p 4 = 0.50r 2 Ab/aBp5p5 p 5 = 0.50r 2 p 5 = 0.50(1 – r) 2 Ab/Abp6p6 p 6 = 0.25r 2 p 6 = 0.25(1 – r) 2 Ab/abp7p7 p 7 = 0.50r(1 - r) aB/aBp8p8 p 8 = 0.25r 2 p 8 = 0.25(1 – r) 2 aB/abp9p9 p 9 = 0.50r(1 - r) ab/abp 10 p 10 = 0.25(1 - r) 2 p 10 = 0.25r 2 Co-dominant Fully classified double hets. Locus A = A and a Locus B = B and b r = recombination frequency between locus A and B

14
Expected and Observed Genotypic Frequencies Coupling (AB/ab) F 2 Progeny GenotypeObserved Frequency Coupling AB/ABq1q1 q 1 = 0.25(1 - r) 2 AB/aBq2q2 q 2 = 0.50r(1 - r) AB/Abq3q3 q 3 = 0.50r(1 - r) AB/ab + Ab/aBq4q4 q 4 = p 4 + p 5 = 0.50[(1 - r) 2 +r 2 ] Ab/Abq5q5 q 5 = 0.25r 2 Ab/abq6q6 q 6 = 0.50r(1 - r) aB/aBq7q7 q 7 = 0.25r 2 aB/abq8q8 q 8 = 0.50r(1 - r) ab/abq9q9 q 9 = 0.25(1 - r) 2 Co-dominant Unclassified double heterozygotes Locus A = A and a Locus B = B and b r = recombination frequency between locus A and B
![Expected and Observed Genotypic Frequencies Coupling (AB/ab) F 2 Progeny GenotypeObserved Frequency Coupling AB/ABq1q1 q 1 = 0.25(1 - r) 2 AB/aBq2q2 q 2 = 0.50r(1 - r) AB/Abq3q3 q 3 = 0.50r(1 - r) AB/ab + Ab/aBq4q4 q 4 = p 4 + p 5 = 0.50[(1 - r) 2 +r 2 ] Ab/Abq5q5 q 5 = 0.25r 2 Ab/abq6q6 q 6 = 0.50r(1 - r) aB/aBq7q7 q 7 = 0.25r 2 aB/abq8q8 q 8 = 0.50r(1 - r) ab/abq9q9 q 9 = 0.25(1 - r) 2 Co-dominant Unclassified double heterozygotes Locus A = A and a Locus B = B and b r = recombination frequency between locus A and B](http://images.slideplayer.com/24/7525509/slides/slide_14.jpg "Expected and Observed Genotypic Frequencies Coupling (AB/ab) F 2 Progeny GenotypeObserved Frequency Coupling AB/ABq1q1 q 1 = 0.25(1 - r) 2 AB/aBq2q2 q 2 = 0.50r(1 - r) AB/Abq3q3 q 3 = 0.50r(1 - r) AB/ab + Ab/aBq4q4 q 4 = p 4 + p 5 = 0.50[(1 - r) 2 +r 2 ] Ab/Abq5q5 q 5 = 0.25r 2 Ab/abq6q6 q 6 = 0.50r(1 - r) aB/aBq7q7 q 7 = 0.25r 2 aB/abq8q8 q 8 = 0.50r(1 - r) ab/abq9q9 q 9 = 0.25(1 - r) 2 Co-dominant Unclassified double heterozygotes Locus A = A and a Locus B = B and b r = recombination frequency between locus A and B")
15
Expected and Observed Genotypic Frequencies Coupling (AB/ab) and Repulsion (Ab/aB) F 2 Progeny GenotypeObserved Frequency CouplingRepulsion A_B_f1f1 f 1 = 0.25(3 - 2r + r 2 )f 1 = 0.25(2 + r 2 ) A_bbf2f2 f 2 = 0.25(2r – r 2 )f 2 = 0.25(1 – r 2 ) aaB_f3f3 f 3 = 0.25(2r – r 2 )f 3 = 0.25(1 – r 2 ) aabbf4f4 f 4 = 0.25(1 - r) 2 f 4 = 0.25r 2 Dominant Locus A = A and a Locus B = B and b r = recombination frequency between locus A and B
 and Repulsion (Ab/aB) F 2 Progeny GenotypeObserved Frequency CouplingRepulsion A_B_f1f1 f 1 = 0.25(3 - 2r + r 2 )f 1 = 0.25(2 + r 2 ) A_bbf2f2 f 2 = 0.25(2r – r 2 )f 2 = 0.25(1 – r 2 ) aaB_f3f3 f 3 = 0.25(2r – r 2 )f 3 = 0.25(1 – r 2 ) aabbf4f4 f 4 = 0.25(1 - r) 2 f 4 = 0.25r 2 Dominant Locus A = A and a Locus B = B and b r = recombination frequency between locus A and B")
16
Analysis 1.Single-locus analysis 2.Two-locus analysis 3.Detecting linkage and grouping 4.Ordering loci 5.Multi-point analysis

17
Mendelian Genetic Analysis Phenotypic and Genotypic Distributions The expected segregation ratio of a gene is a function of the transmission probabilities If a gene produces a discrete phenotypic distribution, then an intrinsic hypothesis can be formulated to test whether the gene produces a phenotypic distribution consistent with a expected segregation ratio of the gene The heritability of a phenotypic trait that produces a Mendelian phenotypic distribution is ~1.0. Such traits are said to be fully penetrant The heritability of a DNA marker is theoretically ~1.0; however, it is affected by genotyping errors

18
Mendelian Genetic Analysis Hypothesis Tests The expected segregation ratio (null hypothesis) is specified on the basis of the observed phenotypic or genotypic distribution One-way tests are performed to test for normal segregation of individual phenotypic or DNA markers –If the observed segregation ratio does not fit the expected segregation ratio, then the null hypothesis is rejected. The expected segregation ratio is incorrect Selection may have operated on the locus The locus may not be fully penetrant A Type I error has been committed

19
Mendelian Genetic Analysis Hypothesis Tests Two-way tests are performed to test for independent assortment (null hypothesis - no linkage) between two phenotypic or DNA markers. –If two genes do not sort independently, then the null hypothesis is rejected The two genes are linked (r < 0.50) The expected segregation ratio is incorrect A Type I error has been committed.
 The expected segregation ratio is incorrect A Type I error has been committed..")
20
Mendelian Genetics Analysis Null Hypothesis AcceptReject True No error 1 - Type I error False positive False Type II error False negative No error 1 -

21
One-way or single-locus tests statistics Log likelihood ratio statistics (G-statistics) i = i th genotype (or allele, or phenotype) Pr[ 2 > 2 df ] = Pr[G > 2 df ] = Goodness of fit statistics
![One-way or single-locus tests statistics Log likelihood ratio statistics (G-statistics) i = i th genotype (or allele, or phenotype) Pr[ 2 > 2 df ] = Pr[G > 2 df ] = Goodness of fit statistics](http://images.slideplayer.com/24/7525509/slides/slide_21.jpg "One-way or single-locus tests statistics Log likelihood ratio statistics (G-statistics) i = i th genotype (or allele, or phenotype) Pr[ 2 > 2 df ] = Pr[G > 2 df ] = Goodness of fit statistics")
22
One-way or single-locus tests GenotypeSample ASample BTotal aa405191 Aa8281163 Total122132254 Two backcross populations (A and B) genotyped for a co-dominant marker (Brandt and Knapp 1993) Null hypothesis 1:1 ratio of aa to Aa Pr[G A > 2 k-1 ] = Pr[14.8 > 2 1 ] = 0.0001 Pr[G B > 2 k-1 ] = Pr[6.88 > 2 1 ] = 0.0086 Null hypothesis is rejected for both samples Individual G-statistics for samples A and B i = i th genotype k = 2 genotypic classes
![One-way or single-locus tests GenotypeSample ASample BTotal aa Aa Total Two backcross populations (A and B) genotyped for a co-dominant marker (Brandt and Knapp 1993) Null hypothesis 1:1 ratio of aa to Aa Pr[G A > 2 k-1 ] = Pr[14.8 > 2 1 ] = Pr[G B > 2 k-1 ] = Pr[6.88 > 2 1 ] = Null hypothesis is rejected for both samples Individual G-statistics for samples A and B i = i th genotype k = 2 genotypic classes](http://images.slideplayer.com/24/7525509/slides/slide_22.jpg "One-way or single-locus tests GenotypeSample ASample BTotal aa Aa Total Two backcross populations (A and B) genotyped for a co-dominant marker (Brandt and Knapp 1993) Null hypothesis 1:1 ratio of aa to Aa Pr[G A > 2 k-1 ] = Pr[14.8 > 2 1 ] = Pr[G B > 2 k-1 ] = Pr[6.88 > 2 1 ] = Null hypothesis is rejected for both samples Individual G-statistics for samples A and B i = i th genotype k = 2 genotypic classes")
23
One-way or single-locus tests GenotypeSample ASample BTotal aa405191 Aa8281163 Total122132254 Two backcross populations (A and B) genotyped for a co-dominant marker (Brandt and Knapp 1993) Null hypothesis 1aa to 1Aa ratio for pooled samples Pr[G P > 2 k-1 ] = Pr[20.7 > 2 1 ] = 0.0000054 Null hypothesis is rejected Pooled G-statistic across samples i = i th genotype j = j th sample k = genotypic classes p = No. of samples (populations)
![One-way or single-locus tests GenotypeSample ASample BTotal aa Aa Total Two backcross populations (A and B) genotyped for a co-dominant marker (Brandt and Knapp 1993) Null hypothesis 1aa to 1Aa ratio for pooled samples Pr[G P > 2 k-1 ] = Pr[20.7 > 2 1 ] = Null hypothesis is rejected Pooled G-statistic across samples i = i th genotype j = j th sample k = genotypic classes p = No.](http://images.slideplayer.com/24/7525509/slides/slide_23.jpg "of samples (populations).")
24
One-way or single-locus tests GenotypeSample ASample BTotal aa405191 Aa8281163 Total122132254 Two backcross populations (A and B) genotyped for a co- dominant marker (Brandt and Knapp 1993) Null hypothesis Samples A and B are homogenous Pr[G H > 2 (k-1)(p-1) ] = Pr[0.94 > 2 1 ] = 0.33 (N.S.) The heterogeneity G-statistic is i = i th genotype j = j th sample (population) k = genotypic classes p = No. of samples (populations) n = Total No. of observations
![One-way or single-locus tests GenotypeSample ASample BTotal aa Aa Total Two backcross populations (A and B) genotyped for a co- dominant marker (Brandt and Knapp 1993) Null hypothesis Samples A and B are homogenous Pr[G H > 2 (k-1)(p-1) ] = Pr[0.94 > 2 1 ] = 0.33 (N.S.) The heterogeneity G-statistic is i = i th genotype j = j th sample (population) k = genotypic classes p = No.](http://images.slideplayer.com/24/7525509/slides/slide_24.jpg "of samples (populations) n = Total No. of observations.")
25
One-way or single-locus tests Pr[G T > 2 p(k-1) ] = Pr[21.7 > 2 2 ] = 0.00002 SourceGdfPr > G Sample A14.7k-1 = 2-1 =10.0001 Sample B6.9k-1 = 2-1 =10.0086 Total21.6p(k-1) = 2(2-1) = 20.00002 Pooled20.7k-1 = 2-1 =10.000005 Heterogeneity0.9(k-1)(p-1) = (2-1)(2-1) = 10.33 Total21.6p(k-1) = 2(2-1) = 20.00002 Relationship between G statistics k = genotypic classes p = No. of samples (populations)
![One-way or single-locus tests Pr[G T > 2 p(k-1) ] = Pr[21.7 > 2 2 ] = SourceGdfPr > G Sample A14.7k-1 = 2-1 = Sample B6.9k-1 = 2-1 = Total21.6p(k-1) = 2(2-1) = Pooled20.7k-1 = 2-1 = Heterogeneity0.9(k-1)(p-1) = (2-1)(2-1) = Total21.6p(k-1) = 2(2-1) = Relationship between G statistics k = genotypic classes p = No.](http://images.slideplayer.com/24/7525509/slides/slide_25.jpg "of samples (populations).")
26
One-way or single-locus tests Allelic constitutionGenotypeObservedExpected 120bp /120bpaa2123.5 120bp /124bpAa4447 124bp /124bpAA2923.5 Total94 F 2 progeny of Ae. cylindrica genotyped for the SSR marker barc98. Null hypothesis 1:2:1 ratio of aa:Aa:AA Pr[G > 2 k-1 ] = Pr[1.67 > 2 2 ] = 0.434 Null hypothesis is not rejected Individual G-statistics for samples A and B i = i th genotype k = 3 genotypic classes

27
Calculating probability values for Chi-square distributions SAS program data pv; Input x df; datalines; 3.75 2 ; data pvalue; set pv; pvalue = 1 – probchi (x, df); output; proc print; run; Output Obs x df pvalue 1 3.75 2 0.15335 Excel formula =CHIDIST(x, degrees_fredom) =CHIDIST(3.75, 2) Output 0.15335
; output; proc print; run; Output Obs x df pvalue Excel formula =CHIDIST(x, degrees_fredom) =CHIDIST(3.75, 2) Output")
Similar presentations


>")


