Download presentation
Presentation is loading. Please wait.

1
Non-invasive methods to assess hepatic fibrosis MIRELLA FRAQUELLI MD PhD - DARIO CONTE MD Gastroenterology and Endoscopy Unit Fondazione IRCCS “Cà Granda” Ospedale Maggiore Policlinico – Milano Department of Pathophysiology and Transplantation Università degli Studi – Milano, Italy Rome – June 19, 2015

2
Serum markers and clinical scores Transient elastography Acoustic Radiation Force (ARFI), Shear Wave Elastography (SWE) … Non - invasive methods to assess hepatic fibrosis
, Shear Wave Elastography (SWE) … Non - invasive methods to assess hepatic fibrosis")
3
DIRECT They are directly linked to changes in extracellular matrix turnover occurring during fibrogenesis INDIRECT They reflect the derangement of hepatic function, but not the extracellular matrix metabolism Serum markers to assess hepatic fibrosis

4
SERUM BIOMARKERS TO ASSESS FIBROSIS IN CLD – HCV ( I ) FIBROTEST : a-2-macroglobulin gGT, apolipoprotein A1, haptoglobin, bilirubin, age, gender FORNS INDEX : age, platelet count, cholesterol, GGT AST TO PLATELET RATIO (APRI) : AST, platelet count FIBROSPECT : a-2-macroglobulin, hyaluronate, TIMP-1 LOK INDEX : platelet count, AST/ALT ratio, INR MP3 : MMP-3, TIMP-1 ELF (Enhanced Liver Fibrosis score) : age, hyaluronate, MMP-3, TIMP-1
 FIBROTEST : a-2-macroglobulin gGT, apolipoprotein A1, haptoglobin, bilirubin, age, gender FORNS INDEX : age, platelet count, cholesterol, GGT AST TO PLATELET RATIO (APRI) : AST, platelet count FIBROSPECT : a-2-macroglobulin, hyaluronate, TIMP-1 LOK INDEX : platelet count, AST/ALT ratio, INR MP3 : MMP-3, TIMP-1 ELF (Enhanced Liver Fibrosis score) : age, hyaluronate, MMP-3, TIMP-1")
5
SERUM BIOMARKERS TO ASSESS FIBROSIS IN CLD – HCV ( II ) GUCI (Gotebörg University Cirrhosis Index) : AST, INR, platelet count VIRAHEP – C MODEL : AST, platelet count, alkaline phosphatase, age FIBROINDEX : platelet count, AST, gamma-globulin FIB-4 : platelet count, ALT, AST HALT-C MODEL : hyaluronic acid, TIMP-1, platelet count HEPASCORE : bilirubin, GGT, hyaluronate, a-2-macroglobulin, age, gender FIBROMETERS : platelet count, prothrombin index, AST, a-2-macroglobulin, hyaluronate, urea, age
 GUCI (Gotebörg University Cirrhosis Index) : AST, INR, platelet count VIRAHEP – C MODEL : AST, platelet count, alkaline phosphatase, age FIBROINDEX : platelet count, AST, gamma-globulin FIB-4 : platelet count, ALT, AST HALT-C MODEL : hyaluronic acid, TIMP-1, platelet count HEPASCORE : bilirubin, GGT, hyaluronate, a-2-macroglobulin, age, gender FIBROMETERS : platelet count, prothrombin index, AST, a-2-macroglobulin, hyaluronate, urea, age")
6
SERUM BIOMARKERS TO ASSESS FIBROSIS IN CLD – HBV Fibrotest : a-2-macroglobulin gGT, apolipoprotein A1, haptoglobin, bilirubin, age, gender Hui score : BMI, bilirubin, platelet count and albumin Zeng score : age, a-2-macroglobulin, hyaluronate and GGT AST to Platelet Ratio (APRI) : AST, platelet count
 : AST, platelet count")
7
Serum PanelF>2 (%)Cut offSensSpecLR+LR-AUROC Fibrotest80>0.4875855.00.30.87 Forns’ index26 6.994-3151-951.9-60.1-0.70.81 APRI50 1.591-4147-951.7-8.20.2-0.60.80 Fibrospect52>0.3677732.90.30.83 Hepascore57>0.563895.70.40.82 Fibrometer56NA80845.00.20.89 Fibroindex50 2.2540-3097-9710-13.30.6-0.20.83 Serum biomarkers in chronic hepatitis C for diagnosing F >2 Optimal diagnostic test LR+ > 10 and LR- < 0.1
Cut offSensSpecLR+LR-AUROC Fibrotest80> Forns’ index APRI Fibrospect52> Hepascore57> Fibrometer56NA Fibroindex Serum biomarkers in chronic hepatitis C for diagnosing F >2 Optimal diagnostic test LR+ > 10 and LR- < 0.1")
8
Serum PanelF>2 (%) Cut offSensSpecLR+LR-AUROC Fibrotest14>0.7463844.00.40.82 APRI17 2.089-5775-933.6-8.10.1-0.50.89 FiB-417 3.3574-3881-983.9-190.3-0.60.85 Lok index38 0.598-4053-992.1- 400.04-0.60.81 NFS27≤ 1.455 > 0.67677-4397-9710-13.30.6-0.70.82 Hepascore16>0.84718.96.50.30.89 HALT-C38 0.588-4745-921.6-5.90.3-0.60.81 Serum biomarkers in chronic hepatitis C for diagnosing F=4 Optimal diagnostic test LR+ > 10 and LR- < 0.1
 Cut offSensSpecLR+LR-AUROC Fibrotest14> APRI FiB Lok index NFS27≤ > Hepascore16> HALT-C Serum biomarkers in chronic hepatitis C for diagnosing F=4 Optimal diagnostic test LR+ > 10 and LR- < 0.1")
9
Pros Cons Good reproducibilityNot specific for the liver High applicabilityUnable to discriminate intermediate stages of fibrosis Well validatedCost and limited availability (patented) Can be performed in outpatients Limitations (hemolysis, inflammation, Gilbert’s syndrome..) Serum biomarkers in HBV or HCV CLD
 Can be performed in outpatients Limitations (hemolysis, inflammation, Gilbert’s syndrome..) Serum biomarkers in HBV or HCV CLD")
10
Elastography - Key features Manual compressionAcoustic Radiation Force (ARFI) Mechanical stimulation No imaging Absolute quantification (shear wave technology) Absolute quantification STRAIN IMAGING POINT QUANTIFICATION SHEARWAVE QUANTIFICATION KPa, m/s 2D SHEARWAVE IMAGING (SWE) TRANSIENT ELASTOGRAPHY KPa, m/s Elastography Qualitative / Relative quantification
 Mechanical stimulation No imaging Absolute quantification (shear wave technology) Absolute quantification STRAIN IMAGING POINT QUANTIFICATION SHEARWAVE QUANTIFICATION KPa, m/s 2D SHEARWAVE IMAGING (SWE) TRANSIENT ELASTOGRAPHY KPa, m/s Elastography Qualitative / Relative quantification")
11
Elastography - Key features Manual compressionAcoustic Radiation Force (ARFI) Mechanical stimulation No imaging Absolute quantification (shear wave technology) Absolute quantification STRAIN IMAGING POINT QUANTIFICATION SHEARWAVE QUANTIFICATION KPa, m/s 2D SHEARWAVE IMAGING (SWE) TRANSIENT ELASTOGRAPHY KPa, m/s Elastography Qualitative / Relative quantification
 Mechanical stimulation No imaging Absolute quantification (shear wave technology) Absolute quantification STRAIN IMAGING POINT QUANTIFICATION SHEARWAVE QUANTIFICATION KPa, m/s 2D SHEARWAVE IMAGING (SWE) TRANSIENT ELASTOGRAPHY KPa, m/s Elastography Qualitative / Relative quantification")
12
US transducer: 3.5 MHz Vibrator: mild amplitude and low frequency (50 Hz) elastic waves Propagation speed of elastic waves: directly related to tissue stiffness TE – Physical principles and functioning Transient elastography (TE): a rapid, non-invasive technique conceived to evaluate hepatic fibrosis by measuring liver stiffness.
 elastic waves Propagation speed of elastic waves: directly related to tissue stiffness TE – Physical principles and functioning Transient elastography (TE): a rapid, non-invasive technique conceived to evaluate hepatic fibrosis by measuring liver stiffness.")
13
The stiffer the tissue, the faster the shear wave propagates TE – Results Depth (mm) Time (ms) Depth (mm) Time (ms) Depth (mm) Time (ms)
 Time (ms) Depth (mm) Time (ms) Depth (mm) Time (ms)")
14
TE – Examination Probe Explored volume TE: 1/500 of the liver total mass Liver biopsy: 1/50000 of the liver total mass

15
TE – Reproducibility and normal values

16
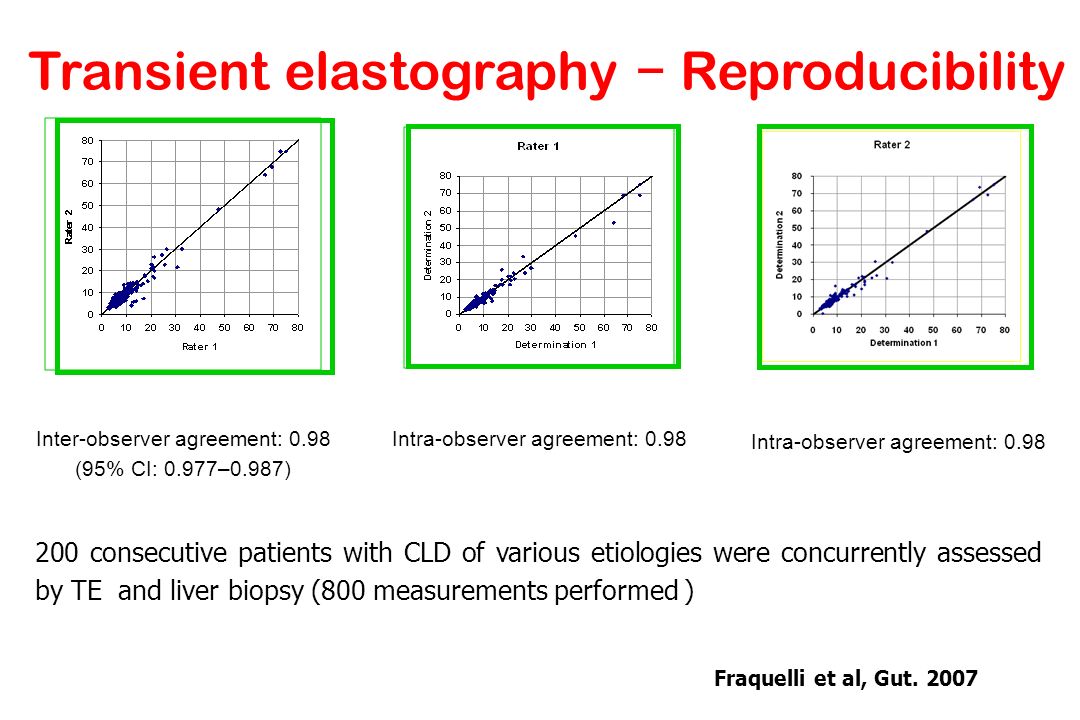
200 consecutive patients with CLD of various etiologies were concurrently assessed by TE and liver biopsy (800 measurements performed ) Inter-observer agreement: 0.98 (95% CI: 0.977–0.987) Intra-observer agreement: 0.98 Transient elastography − Reproducibility Fraquelli et al, Gut. 2007
17
TE – Normal values Del Poggio et al, WJG 2009 CoperchotRoulotColombo Subjects, n71 Healthy volunteers 429 Medical check-up 327 Blood donors Mean stiffness (Kpa)4.8 (2.5-6.9) 5.4±1.54.9±1.7 95th centile-8.67.8 AgeNo effect GenderM> F High BMIIncreased Metabolic syndrome-Increased- Fatty liver--Increased
4.8 ( ) 5.4±1.54.9±1.7 95th centile AgeNo effect GenderM> F High BMIIncreased Metabolic syndrome-Increased- Fatty liver--Increased")
18
TE - Applicability and limitations

19
TE − Applicability Contraindications Pregnant women Patients with implantable devices (pacemaker or defibrillator) Failure of examination (3-5%) Ascites Narrow intercostal spaces BMI >28 kg/m 2 in 2114 patients ° BMI >30 kg/m 2 in 13369 examinations * Independent factor for failure: ° Foucher et al, Eur J Gastroenterol Hepatol 2006 * Castera et al, Hepatology 2010 Overweight / obesity
 Failure of examination (3-5%) Ascites Narrow intercostal spaces BMI >28 kg/m 2 in 2114 patients ° BMI >30 kg/m 2 in examinations * Independent factor for failure: ° Foucher et al, Eur J Gastroenterol Hepatol 2006 * Castera et al, Hepatology 2010 Overweight / obesity")
20
TE - Unreliable results IQR/LSM >30% 9.2% SR <60% 8.1% VM <10 3.1% 15.8% Castera et al, Hepatology 2010 13369 EXAMINATIONS IQR/LSM >30% 12.8% SR <60% 3.2% VM <10 2.3% 18.3% Colombo et al, Dig Liver Dis 2011 923 BLOOD DONORS

21
LIVER CONGESTION INFLAMMATION EXTRA – HEPATIC CHOLESTASIS STEATOSIS PRIMARY LYMPHANGECTASIA Features influencing TE

22
TE – Diagnostic performances in the assessment of liver fibrosis

23
TE − Correlation with liver fibrosis Ziol et al, Hepatology 2005 Castera et al, Gastroenterology 2005 However, there is a substantial overlap of TE results between adjacent stages of liver fibrosis. TE results significantly correlate with liver fibrosis stage: correlation coefficients ranging from 0.55 to 0.84.

24
TE performance in diagnosing F≥2 in HCV Author, yrEtiologyPatient # Cut-off kPa Sensitivity % Specificity % -LR+LRAUROC Ziol, 2005HCV2518.656910.486.60.79 Castera, 2005HCV1837.167890.376.00.83 Coco, 2007HCV-HBV2288.385910.169.40.93 Fraquelli, 2007mixed2007.972840.304.60.86 Arena, 2008HCV1507.883820.204.60.91 Lupşor, 2008HCV3247.476840.304.60.86 Degos, 2010mixed13075.290320.301.30.75 Zarski, 2012HCV3825.297350.081.40.82 Optimal diagnostic test LR+ > 10 and LR- < 0.1

25
Author, yrEtiologyDisease prev (%) Patient # Cut-off, kPa Sens (%) Spec (%) -LR+LRAUROC Ziol, 2005HCV1925114.686960.1423.00.87 Castera, 2005HCV2518312.587910.149.70.95 Ganne-Carrié 2006 Mixed1577514.679950.1115.80.95 Coco, 2007 HCV- HBV 2015914.078980.22390.96 Fraquelli, 2007Mixed1820012.091890.108.20.90 Arena, 2008HCV1915014.894920.0711.30.98 Lupşor, 2008HCV2132411.887910.149.40.94 Zarski, 2012HCV1538212.977900.257.70.93 TE in diagnosing HCV - cirrhosis Optimal diagnostic test LR+ > 10 and LR- < 0.1
 Patient # Cut-off, kPa Sens (%) Spec (%) -LR+LRAUROC Ziol, 2005HCV Castera, 2005HCV Ganne-Carrié 2006 Mixed Coco, 2007 HCV- HBV Fraquelli, 2007Mixed Arena, 2008HCV Lupşor, 2008HCV Zarski, 2012HCV TE in diagnosing HCV - cirrhosis Optimal diagnostic test LR+ > 10 and LR- < 0.1")
26
TE performance in diagnosing F≥2 in HBV Author, yrPatient # Cut-off kPa Sensitivity % Specificity % -LR+LRAUROC Coco 20072288.385910.29.40.93 Olivieri 20081887.594880.067.80.97 Marcellin 20091737.270830.33.40.81 Wang 2009888.080770.23.40.86 Degos 20102845.289380.51.40.78 Sporea 20101407.065590.65.90.65 Cordoso 20122027.274880.26.10.87 Goyal 20133576.082670.23.50.84 Optimal diagnostic test LR+ > 10 and LR- < 0.1

27
TE performance in diagnosing F=4 in HBV Author, yrPatient # Cut-off kPa Sensitivity % Specificity % -LR+LRAUROC Coco 200722814.078980.2390.96 Olivieri 200818811.886960.04210.97 Marcellin 200917311.093870.087.10.93 Wang 20098810.085880.17.00.89 Degos 201028412.952930.57.40.85 Sporea 201014013.686990.1860.97 Cordoso 201220211.075900.17.50.93 Goyal 20133579.081900.28.10.93 Optimal diagnostic test LR+ > 10 and LR- < 0.1

28
FIBROSTIC study (France, 2006–2008). ROC curves of non-invasive liver fibrosis tests to diagnose F≥2 and F=4 in 1307 patients Degos et al, J Hepatol 2010 F≥2F=4

29
BORDEAUX ALGORITHM Castera et al. Gastroenterology 2005 Castera et al. J Hepatol 2010 AUROC F>2 0.91 (0.86-0.96) F=4 0.93 (0.90-0.96) Sequential diagnostic algorithms
 F= ( ) Sequential diagnostic algorithms.")
30
TE – Monitoring of disease progression

31
Foucher et al, Gut 2006 Monitoring disease progression by TE 14 27.5 49.1 53.7 62.7 75 kPa F=4 EV Ascites HCC EV bleeding

32
Does TE and Fibrotest have a prognostic value in the context of cirrhosis? MULTIVARIATE ANALYSIS HR (95% CI) P value LIVER BIOPSY2.6 (1.8–3.8).0001 TE44 (15–127).0001 FIBROTEST90 (15–549).0001 APRI2.8 (1.6-4.7).0002 Vergniol et al. Gastro 2012
 P value LIVER BIOPSY2.6 (1.8–3.8).0001 TE44 (15–127).0001 FIBROTEST90 (15–549).0001 APRI2.8 ( ).0002 Vergniol et al. Gastro")
33
Does TE have a prognostic value in the context of CLD? Robic et al. J Hepatol 2011 Performances of LS and HVPG for the prediction of PH-related complications All Cirrhotics

34
Elastography - Key features Manual compressionAcoustic Radiation Force (ARFI) Meccanic stimulation No imaging Absolute quantification (shear wave technology) Absolute quantification STRAIN IMAGING POINT QUANTIFICATION SHEARWAVE QUANTIFICATION KPa, m/s 2D SHEARWAVE IMAGING (SWE) TRANSIENT ELASTOGRAPHY KPa, m/s Elastography Qualitative / Relative quantification
 Meccanic stimulation No imaging Absolute quantification (shear wave technology) Absolute quantification STRAIN IMAGING POINT QUANTIFICATION SHEARWAVE QUANTIFICATION KPa, m/s 2D SHEARWAVE IMAGING (SWE) TRANSIENT ELASTOGRAPHY KPa, m/s Elastography Qualitative / Relative quantification")
35
PSWE (ElastPQ) - Reproducibility Baccarin et al. FISMAD 2015 150 CLD patients : ICC 0.87 (95% CI 0.82- 0.90) Learning curve
 Learning curve.")
36
Acoustic Radiation Force Impulse (ARFI- PSWE) Volume measured: 10 mm long and 6 wide Author, yrEtiologyPatient # Cut-off m/sec Sensitivity % Specificity % -LR+LRAUROC Lupsor 2009HCV1121.3467920.39.40.86 Friedrich Rust 2012HBV921.3950900.55.10.73 Yoon 2012mixed2041.1358840.53.60.74 Sporea 2013mixed3321.3475690.32.4- Cassinotto 2014mixed3491.5172810.33.70.81 Diagnosis of F≥2
 Volume measured: 10 mm long and 6 wide Author, yrEtiologyPatient # Cut-off m/sec Sensitivity % Specificity % -LR+LRAUROC Lupsor 2009HCV Friedrich Rust 2012HBV Yoon 2012mixed Sporea 2013mixed Cassinotto 2014mixed Diagnosis of F≥2")
37
Acoustic Radiation Force Impulse (ARFI-PSWE) Volume measured: 10 mm long and 6 wide Author, yrEtiologyPatient # Cut-off m/sec Sensitivity % Specificity % -LR+LRAUROC Lupsor 2009HCV1122.080950.2170.93 Piscaglia 2011 mixed701.781880.27.00.91 Xe 2012HBV2041.8895910.05120.97 Sporea 2013mixed3321.886770.13.7- Cassinotto 2014mixed3492.281770.23.50.84 Diagnosis of F=4
 Volume measured: 10 mm long and 6 wide Author, yrEtiologyPatient # Cut-off m/sec Sensitivity % Specificity % -LR+LRAUROC Lupsor 2009HCV Piscaglia 2011 mixed Xe 2012HBV Sporea 2013mixed Cassinotto 2014mixed Diagnosis of F=4")
38
ARFI vs TE : meta-analysis Bota et all. Liver Int 2013 TechniqueFibrosis stage SensSpecLR+LR-AUROC TEF>2F>20.78 (9.72-0.83) 0.84 (0.75-0.90) 4.8 (2.9-7.8) 0.26 (0.1-0.3) 0.87 (0.83-0.89) ARFIF>2F>20.74 (0.66-0.80) 0.83 (0.85-0.89) 4.2 (2.8-6.3) 0.31 (0.2-0.4) 0.85 (0.82-0.88) TEF=4 0.89 (0.80–0.94) 0.87 (0.82-0.91) 6.7 (4.7–9.8) 0.13 (0.07– 0.2) 0.93 (0.91-0.95 ARFIF=40.87 (0.79–0.92) 0.87 (0.81–0.91) 6.4 (4.4–9.4) 0.15 (0.09–0.2) 0.93 (0.91–0.95) Cumulative diagnostic estimates
 0.84 ( ) 4.8 ( ) 0.26 ( ) 0.87 ( ) ARFIF>2F>20.74 ( ) 0.83 ( ) 4.2 ( ) 0.31 ( ) 0.85 ( ) TEF= (0.80–0.94) 0.87 ( ) 6.7 (4.7–9.8) 0.13 (0.07– 0.2) 0.93 ( ARFIF=40.87 (0.79–0.92) 0.87 (0.81–0.91) 6.4 (4.4–9.4) 0.15 (0.09–0.2) 0.93 (0.91–0.95) Cumulative diagnostic estimates.")
39
Shear wave elastography (SWE/PSWE) StudyCut offSensSpecLR+LR-AUROC Ferraioli 2012 (SWE) 7.190977.20.10.92 (0.85-0.96) Sporea 2014 (SWE) 7.876824.20.20.86 Ferraioli 2014 (PSWE) 5.762927.40.40.80 (0.71-0.87) Diagnosis of F≥2
 StudyCut offSensSpecLR+LR-AUROC Ferraioli 2012 (SWE) ( ) Sporea 2014 (SWE) Ferraioli 2014 (PSWE) ( ) Diagnosis of F≥2")
40
Shear wave elastography (SWE/PSWE) StudyCut offSensSpecLR+LR-AUROC Ferraioli 2012 (SWE) 10.48797270.10.98 (0.93-1) Sporea 2014 (SWE) 11.5809311.40.20.91 Ferraioli 2014* (PSWE) 7.290887.90.10.95 (0.89-0.99) Diagnosis of F=4
 StudyCut offSensSpecLR+LR-AUROC Ferraioli 2012 (SWE) (0.93-1) Sporea 2014 (SWE) Ferraioli 2014* (PSWE) ( ) Diagnosis of F=4")
41
PROS TE vs ARFI vs SWE TEARFISWE - Short learning curve - Good reproducibility - High range of value (2- 75 KPa) - Quality criteria well defined -Prognostic value for cirrhosis - Implemented on regular US devices - ROI smaller than TE but chosen by the operator - Higher applicability than TE (ascites, obesity) - Performances equivalent to that of TE - Implemented on regular US devices - ROI can be adjusted in size and chosen by the operator - High range of value (2-150 KPa) - Performances may be higher than TE for F>2
 - Quality criteria well defined -Prognostic value for cirrhosis - Implemented on regular US devices - ROI smaller than TE but chosen by the operator - Higher applicability than TE (ascites, obesity) - Performances equivalent to that of TE - Implemented on regular US devices - ROI can be adjusted in size and chosen by the operator - High range of value (2-150 KPa) - Performances may be higher than TE for F>2")
42
CONS TE vs ARFI vs SWE TEARFISWE - Dedicated device -ROI cannot chosen -Unable to discriminate between intermediate stages of fibrosis -Low applicability (80%) (obesity, ascites..) -FP in case of acute hepatitis, extra hepatic cholestasis, vascular congestion - Ongoing validation - Unit different from that of TE (m/sec) - Unable to discriminate between intermediate stages of fibrosis -Narrow range of values (0.5-4 m/sec) -Influence of inflammation? -Prognostic value in cirrhosis ? - Ongoing validation -Limited data on reproducibility - Unable to discriminate between intermediate stages of fibrosis -Learning curve ? -Quality criteria ? -Influence of inflammation? -Prognostic value in cirrhosis ?

43
TE – Assessment of spleen stiffness

44
113 patients with HCV related cirrhosis underwent : TE, HVPG and LB Colecchia et al Gastro 2012 TE – Assessment of spleen stiffness (SS) and portal hypertension (PH)
 and portal hypertension (PH)")
45
StudyCut offSensSpecLR+LR-AUROC Stefaneuscu 2011 4683712.80.20.78 Colecchia 2012 41 55 98 71 66 96 2.9 16.8 0.02 0.2 0.94 (0.90-0.98) Calvaruso 2013 5065611.70.60.70 Fraquelli 2014 48 65 100 91 60 80 2.5 4.5 0.01 0.1 0.90 (0.79-100) Sharma 2014 4194763.90.080.89 (0.84-0.95) SS and the diagnosis of EV
 Calvaruso Fraquelli ( ) Sharma ( ) SS and the diagnosis of EV")
46
No events (n=43; 54%) Clinical decompensation (n=26; 32%) Other events without previous decompensation (n=11; 14%) Events occurred during a 2 years f-up period 80 HCV patients SS and LS for clinical complications in compensated cirrhotics - A prospective study. Colecchia et al. J Hepatol 2014

47
Risk of clinical decompensation Cox regression analysis VariableUnivariateMultivariate HR (95%CI)p pβStd error β HVPG1.21 (1.11-1.32)<0.0001---- LS1.06 (1.03-1.08)<0.0001---- SS1.09 (1.05-1.13)<0.00011.08 (1.04-1.13) <0.00010.0810.020 MELD1.63 (1.26-2.10)0.00021.43 (1.07-1.91) 0.01600.3570.148 LS = liver stiffness; SS = spleen stiffness Colecchia et al. J Hepatol 2014

48
TE is a user-friendly and reproducible technique that accurately predicts cirrhosis in patients with CLD It is less accurate in diagnosing significant fibrosis when used as single diagnostic non-invasive tool Newly developed US-based elastographic techniques (ARFI etc.) showed similar diagnostic accuracy in fibrosis staging but further validation is needed TE − Conclusions ( I )
 showed similar diagnostic accuracy in fibrosis staging but further validation is needed TE − Conclusions ( I )")
49
Given its prognostic value TE could be used to better categorize patients with cirrhosis and assign them to different classes of risk for clinically relevant outcomes Spleen stiffness measurement allow a reliable prediction of the presence of EV and of hepatic decompensation. TE − Conclusions ( II )
.")
50
Acknowledgements I would thank Francesco Di Mario, MD and Ludovico Abenavoli, MD for the kind invitation and all of you for having attended this lecture, which is dedicated to all my Colleagues, daily involved in taking care of difficult patients.

51
Thank you for your attention!

Similar presentations


 A NEW NON-INVASIVE BIOMARKER FOR ASSESSING LIVER FIBROSIS AND RISK OF PROGRESSION TO HEPATOCELLULAR CARCINOMA N.K. Gatselis,>")


, MRCP, DTM&H Consultant Gastroenterologist.>")


