Download presentation
Presentation is loading. Please wait.

1
Key Performance Indicators for Facility Operations Roger Young FacilityMastersOnline.com roger@facilitymastersonline.com 978-886-6093

2
High Expectations Internal/External More with Less Demonstrate Success Be Credible Simple Truths

3
Demonstrate … quantitative measuring Show … results Develop standards and set expectations Demonstrate effectiveness How to Maintain Credibility

4
Understand the Expectations Know the Key Questions Identify the Metrics Collect Data as Part of the Process Compare Metrics Over Time Benchmark With Others Strategy

5
Properly Maintaining School Facilities Energy Efficiency Maximize Resources Minimize Risk Environmental Safety Expectations

6
Key Questions/Metrics – – What is being done? Completed work orders by type (routine, PM, emergency), trade, system, use of PM templates, cost – How well is it being done? Time to complete, run time, emergencies, staff survey – What needs to be done? Deferred work orders, life cycle analysis, capital needs and renewal, facility audit Properly Maintain School Facilities
, trade, system, use of PM templates, cost – How well is it being done. Time to complete, run time, emergencies, staff survey – What needs to be done. Deferred work orders, life cycle analysis, capital needs and renewal, facility audit Properly Maintain School Facilities.")
7
Collect Data (Timely, Comparable, Accurate) – Work order, date initiated, date completed – Type of work (PM, emergency, routine), location – Category (HVAC, roof, electrical, plumbing, grounds) – Cost, labor time – Type and condition of equipment Part of Process – Maintenance Management System such as SchoolDude.com Properly Maintain School Facilities
 – Work order, date initiated, date completed – Type of work (PM, emergency, routine), location – Category (HVAC, roof, electrical, plumbing, grounds) – Cost, labor time – Type and condition of equipment Part of Process – Maintenance Management System such as SchoolDude.com Properly Maintain School Facilities")
8
Maintenance Program Number of Work Orders Backlog Status of Budget Emergency Work Orders Days to Complete Work Orders PM Hours Quality Assurance

9
Examples …

10
Surveys…

11
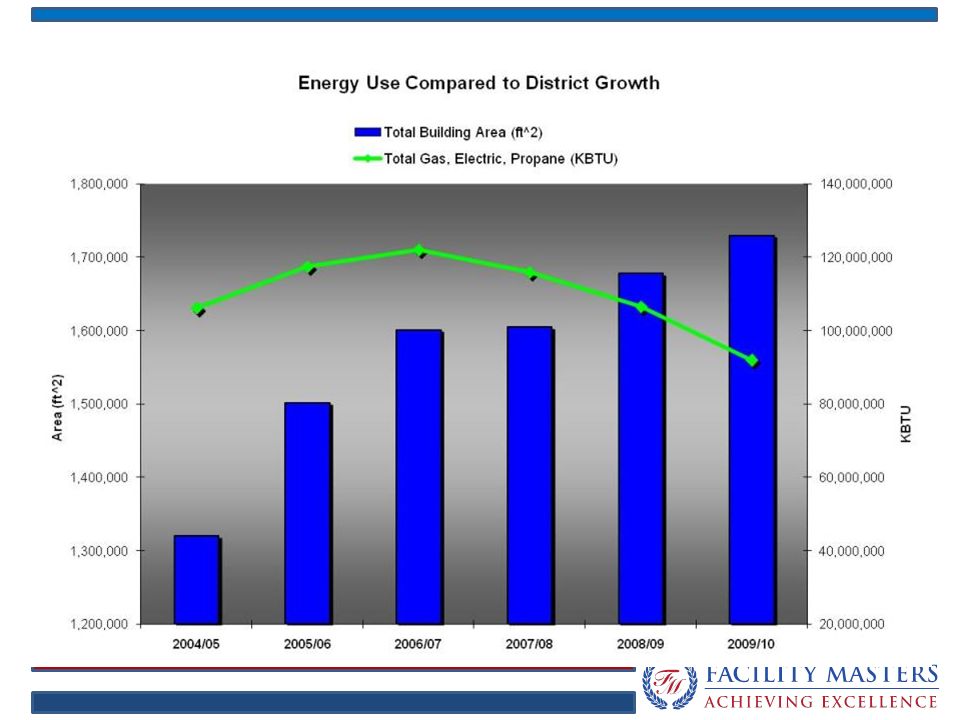
Energy Management … Consumption Conservation Accomplishments Data: BTU’s Sq Ft Buildings Degree Days Comparison Over Time Types of Energy

12
Convert all units to K BTU to benchmark/rank schools according to how much energy they use per square foot. Energy Conversion Factors 1 kWh = 3.412 kBtu 1 Gal Propane = 91.6 kBtu 1 CCF = 103 kBtu 1 Gal #2 Fuel Oil = 139 kBtu

14
SchoolDude UtilityDirect Energy Cost/Sq Ft Report

15
SF / custodian Overall cost in $/SF Custodial materials cost in $/SF Overtime Satisfaction Survey KPI: Custodial

16
Turnover % of staff replaced Change in staff size Attendance rates Average cost of pay and benefits per person KPI: Personnel

17
Square footage per student Students per athletic field Overall cost of custodial, utilities, maintenance in $/SF Comparison metrics: – Overall cost / building age – Overall cost / enrollment – Overall cost / total Percent of district square footage in portables KPI: Overall

18
KPI: Environmental Safety Student injuries Number of inspections Respiratory complaints with nurse State and federal reporting IPM complaints Life safety inspections

19
Understand the Expectations Know the Key Questions Identify the Metrics Collect Data as Part of the Process Compare Metrics Over Time Benchmark With Others Strategy

20
Thank You

Similar presentations


 Topics of Discussion: Energy Reduction Goals Status.>")


