Download presentation
Presentation is loading. Please wait.

1
January 2009 Presented by Mark Swindlehurst

2
What is the total area (m2 or acre) of the Lancaster University Estate ? How many bed spaces does Lancaster University have ? What was Lancaster Universities position in the 2008 People & Planet Green league table ?

3
Lancaster University = 360 Acres 1,455,000m2 Equivalent to 196 Man Utd. football pitches

4
7,109 Bedspaces

5
4,425 Bedspaces 3340 Ensuite 1018 Non- ensuite 49 x 1 bed flats 9 x 2 bed flats

6
2,684 Bedspaces 877 Ensuite bedspaces 1710 Non- ensuite bedspaces 42 x 1 bed flats 14 x 2 bed flats 5 x 3 bed flats 3 x 4 bed flats

7
Maintaining our Estate – at a sustainable level Managing Space & Utilisation Understanding the ‘true’ operating cost of the Estate Supporting and reporting on our Environmental Impact and Carbon Reduction.

9
Estate Management Statistics (EMS) Royal Institution of Chartered Surveyors (RICS) Gross Internal Area (GIA) Net Internal Area (NIA)
 Royal Institution of Chartered Surveyors (RICS) Gross Internal Area (GIA) Net Internal Area (NIA)")
10
Royal Institution of Chartered Surveyors (RICS) grading: A: New B: Sound, operationally safe and exhibiting only minor deterioration C: Operational, but major repair or replacement is needed in the short to medium term D: Inoperable or at serious risk of major failure or breakdown Source: 2008/9 Conditions Survey
 grading: A: New B: Sound, operationally safe and exhibiting only minor deterioration C: Operational, but major repair or replacement is needed in the short to medium term D: Inoperable or at serious risk of major failure or breakdown Source: 2008/9 Conditions Survey")
11
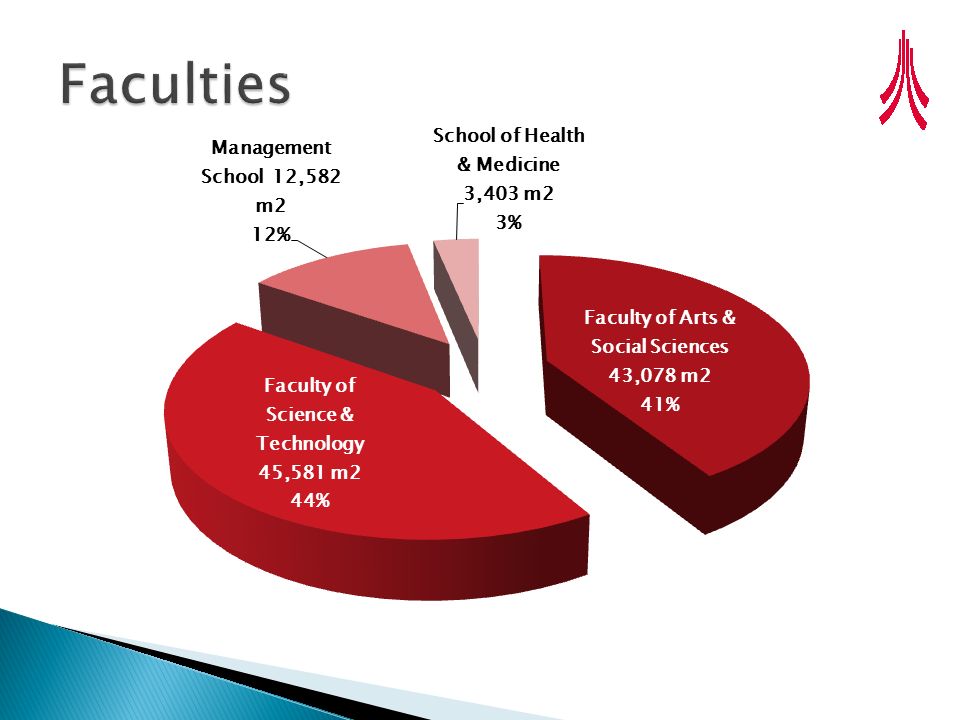
Non-residential 2008/9

12
Source: EMS 2006/7

13
HEFCE/SMG estimate the sustainable estate provision for space to average £147.40 per m2 annually across UK HEIs on the basis of the Estate Management Statistics (EMS) data for 2002-03. This cost comprises: operating cost: £43.80 per m2 maintenance cost: £53.40 per m2 depreciation cost: £50.20 per m2 Add the opportunity cost of capital of £45.10 per m2 The total estate provision is £192.50 per m2

14
2002/03 operating cost: £43.80 per m2 maintenance cost: £53.40 per m2 2008/09 (allowing 3% pa inflation) operating cost: £50.77 per m2 maintenance cost: £61.90 per m2 Sustainable Estate cost £113/m2
 operating cost: £50.77 per m2 maintenance cost: £61.90 per m2 Sustainable Estate cost £113/m2")
15
HEFCE/SMG define the total estate provision as the cost of keeping buildings in their current condition. Therefore, the cost of maintenance includes the cost of all maintenance required to keep the quality of a building’s fittings in good condition.

16
Operating costs are the short-run costs of using a building. Using EMS data, HEFCE/SMG defined operating costs as the sum of an HEI’s energy, rates, water, sewerage, cleaning, security and porterage costs, its insurance premiums and the HEI’s internal and external property management costs.

17
HEFCE/SMG define a building’s depreciation cost as the sum that must be saved each year to be able to replace a building at the end of its natural life and pay for periodic refits to the building.

18
The opportunity cost of capital is the flow of earnings an HEI forgoes by owning a building rather than selling it and investing the proceeds. Therefore, to find the opportunity cost of the capital tied up in the estate, it is necessary to estimate the price that the various parts of the estate would fetch in the market place.

20
Operating & Maintenance cost = £113/m2 (excluding depreciation & opportunity costs) GIA or NIA 115,000m2 x £113/m2 = £13 million pa (excludes residences) Maintenance only = £62/m2 115,000 x £ 62/m2 = £ 7.13 million pa
 GIA or NIA 115,000m2 x £113/m2 = £13 million pa (excludes residences) Maintenance only = £62/m2 115,000 x £ 62/m2 = £ 7.13 million pa")
21
20082013 Insured Value of Estate£420m£500m? Cash Generation£17m£23m Surplus target4-5%5%+ Repairs & Maintenance£3m£8-9m Debt to Income23%<50%

23
ISS 2600m2 = £ 294k Waterside 4000m2 = £ 452k LICA 3000m2 = £ 339k Circa £ 1.1m

24
On revenue we appear to be under investing But....

25
Capital ProgrammeSpent to Projected Spend Projected as at 30th November 2008 Budget July '0808/092008-092009-102010-11Spend £'000s Major Projects £1m+ County South 11,000 275 123 4,025 5,200 1,500 11,000 Sports Centre 20,000 1,227 34 6,723 11,050 1,000 20,000 ISS New Building 9,900 1,992 1,230 7,308 601 9,900 LICA 10,000 253 138 422 5,325 4,000 10,000 Biology & ES 3,557 2,208 1,359 1,352 3,557 - Student Learning Grid 3,000 139 93 1,861 1,000 3,000 Grizedale 3,051 206 153 2,044 801 3,051 Waterside 12,000 273 246 2,227 8,300 1,200 12,000 Health & Medicine (new building) 12,000 - - 500 4,500 7,000 12,000 Conference & Kitchen Facilities 3,500 - - 1,000 2,000 500 3,500 88,008 6,572 3,375# 27,462 38,777 15,200 88,008
 12, ,500 7,000 12,000 Conference & Kitchen Facilities 3, ,000 2, ,500 88,008 6,572 3,375# 27,462 38,777 15,200 88,008")
26
Rolling Programs Estates - Backlog Maintenance 5,165 970 52 2,332 1,000 750 5,165 Landscaping 3,300 674 12 944 1,182 500 3,300 Sports Facilities 2,166 4 - 1,162 500 2,166 Utilities Infrastructure 6,000 71 8 3,929 1,000 6,000 Lecture theatre refurb 2,500 64 0 1,436 500 2,500 Minor Works 2,100 1,086 286 314 350 2,100 Social Provision 2,250 666 19 584 500 2,250 P/E VAT (On Additions) - 625 - 52 - 23,481 3,398 448 10,326 5,032 4,100 23,481
 ,481 3, ,326 5,032 4,100 23,481")
27
We haven’t yet established the budgets to maintain our existing built estate If we are to manage our costs – we also need to better manage space and this includes utilisation We are seeing positive improvements in the centralised timetabling and room bookings The more space we build, the more monies we need to operate and maintain it Do we really need more space ?

31
We need to manage and minimise energy use. We are taking part in the HECMP We already subscribe to BREEAM for all our Developments. Lifecycle costs, not capital costs ! Awareness of the costs in running the Estate Reduce, Reuse, Recycle Sustainable & Renewable energies

32
Source: EMS 2006/7

33
Published by The Times Higher Education in June 2008 Highlights institutions environmental performance Enables students to make choices about institutions based on their ‘green’ credentials as well as academic Lancaster Uni ranked 43 of 119 Universities Key Performance Indicator (KPI) for University Council
 for University Council")
35
We need to interrogate and understand our operating costs We need to acknowledge the Blue Elephant and increase revenue budgets. We need to agree the expenditure/investment plan against ◦ Health & Safety ◦ Strategic Priorities ◦ Condition Survey Data We need to think strategically about space We need to drive the Environmental initiatives

Similar presentations


>")


 April 2013. MTFP The MTFP is a high-level forecasting model that enables the Council to assess the financial direction.>")


>")
, plus ($1,094,808) in State pass throughs. State Aid allocation.>")
