Download presentation
Presentation is loading. Please wait.

1
Using Archived Data to Measure Operational Benefits of a System-wide Adaptive Ramp Metering (SWARM) System TAC Meeting December 13, 2006 Robert Bertini Sue Ahn Oren Eshel
 System TAC Meeting December 13, 2006 Robert Bertini Sue Ahn Oren Eshel")
2
Meeting Outline Introductions Introductions Work Plan Work Plan Progress Report Progress Report Pilot Study Pilot Study Remaining Tasks Remaining Tasks Regional Study Regional Study Next Steps Next Steps Discussion Discussion

3
Work Plan – Progress Report Task 1: Literature Review Task 1: Literature Review Revision will be posted next week Revision will be posted next week Update: Caltrans I-210 Study Update: Caltrans I-210 Study Tasks 2-3: Corridor Selection and Data Collection Plan Tasks 2-3: Corridor Selection and Data Collection Plan Complete – TAC comments incorporated Complete – TAC comments incorporated Task 4: Pilot Study Task 4: Pilot Study TRB Paper – Revision submitted and on Wiki TRB Paper – Revision submitted and on Wiki Additional analysis suggested Additional analysis suggested Poster to be presented in January Poster to be presented in January Task 5: Regional Study Task 5: Regional Study

4
Task 1 – Report Comments TAC literature review comments to be addressed: TAC literature review comments to be addressed: Balancing congestion on freeways and alternate routes (i) Balancing congestion on freeways and alternate routes (i) Evaluation design strategies (ii) Evaluation design strategies (ii) Detection at off-ramps (iii) Detection at off-ramps (iii) Revision will be posted next week Revision will be posted next week Complete: Complete: Added discussion of SWARM 2c (iii) Added discussion of SWARM 2c (iii) Moved figure to better introduce it (iv) Moved figure to better introduce it (iv)
 Balancing congestion on freeways and alternate routes (i) Evaluation design strategies (ii) Evaluation design strategies (ii) Detection at off-ramps (iii) Detection at off-ramps (iii) Revision will be posted next week Revision will be posted next week Complete: Complete: Added discussion of SWARM 2c (iii) Added discussion of SWARM 2c (iii) Moved figure to better introduce it (iv) Moved figure to better introduce it (iv)")
5
Task 1 – Update: I-210 Study Planned Evaluation of I-210 (unpublished) Planned Evaluation of I-210 (unpublished) Phase 1 (11/06) Phase 1 (11/06) Enhancements (?) to existing SWARM system Enhancements (?) to existing SWARM system Evaluation Evaluation Data collection 2 weeks before and after & historical data Data collection 2 weeks before and after & historical data Travel time runs on arterials, manual queue counts Travel time runs on arterials, manual queue counts Phase 2 (12/06 – 6/07) Phase 2 (12/06 – 6/07) Addition of freeway-to-freeway metering Addition of freeway-to-freeway metering Conversion of HOV bypass lanes to metered HOV lanes Conversion of HOV bypass lanes to metered HOV lanes Evaluation Evaluation 2 weeks for adjustment 2 weeks for adjustment Data collection over 4-6 weeks & comparison to historical data Data collection over 4-6 weeks & comparison to historical data Goal: reproducible evaluation framework Goal: reproducible evaluation framework Possible Caltrans connection (formal/informal) ? Possible Caltrans connection (formal/informal) ?
 .")
6
Task 4: OR-217 SB Pilot Study TRB presentation in January TRB presentation in January Paper revised 11/2006 Paper revised 11/2006 Additional analysis suggested by TAC Additional analysis suggested by TAC

7
Task 4: On-Ramp Volume Volumes on key ramps (BH Hwy and Scholls Ferry) Volumes on key ramps (BH Hwy and Scholls Ferry) 3 to 9% higher under SWARM 3 to 9% higher under SWARM TAC Suggestion TAC Suggestion Look at timing rates for pre-timed system and determine whether SWARM parameters should be modified. Look at timing rates for pre-timed system and determine whether SWARM parameters should be modified. FIGURE 8 On-ramp volumes between 6:30AM and 8:30AM.

8
Task 4: Travel Times Travel times for BH Hwy and Scholls Ferry on-ramps (NEW) Travel times for BH Hwy and Scholls Ferry on-ramps (NEW) Under SWARM, 23% lower at BH Hwy and 37% lower at Scholls-Ferry Under SWARM, 23% lower at BH Hwy and 37% lower at Scholls-Ferry 5 minute samples from video, 6-19-06 to 6-29-06 5 minute samples from video, 6-19-06 to 6-29-06 Included in revised TRB paper Included in revised TRB paper FIGURE 9(a) Travel time on the Beaverton-Hillsdale Highway on-ramp. FIGURE 9(b) Travel time on the Scholls-Ferry Rd. on-ramp.
 Travel time on the Scholls-Ferry Rd. on-ramp..")
9
Task 4: Additional Analysis Basic analysis for last two months of pre-timed and first two months of SWARM Basic analysis for last two months of pre-timed and first two months of SWARM So far So far pre-timed: 10/3/05 – 10/7/05 pre-timed: 10/3/05 – 10/7/05 SWARM: 12/5/05 – 12/9/05 SWARM: 12/5/05 – 12/9/05 Results preliminary – significant data issues Results preliminary – significant data issues e.g. 10/3: 1.5 hour communications failure e.g. 10/3: 1.5 hour communications failure Used as an opportunity to refine, streamline data processing tools (75% complete) Used as an opportunity to refine, streamline data processing tools (75% complete) Once complete, will be able to easily process additional days Once complete, will be able to easily process additional days Did we mention that the results are preliminary? Did we mention that the results are preliminary?
 Used as an opportunity to refine, streamline data processing tools (75% complete) Once complete, will be able to easily process additional days Once complete, will be able to easily process additional days Did we mention that the results are preliminary. Did we mention that the results are preliminary .")
10
VMT 6/06 Pre-timed and SWARM 10/05 Pre-timed, 12/05 SWARM (Preliminary)
")
11
VHT 6/06 Pre-timed and SWARM 10/05 Pre-timed, 12/05 SWARM (Preliminary)
")
12
Delay 6/06 Pre-timed and SWARM 10/05 Pre-timed, 12/05 SWARM (Preliminary)
")
13
Performance Measures (6-9AM) VMTVHT Travel-Time (minutes) Delay (veh-hrs) Pre-Timed SWARM % Change VMTVHT Travel-Time (minutes) Delay (veh-hrs) Pre-Timed65,8711,3378.8210 SWARM66,4261,4169.2283 % Change0.8%6.0%5.1%34.7% 10/05 Pre-timed, 12/05 SWARM (Preliminary) 6/06 Pre-timed and SWARM
 VMTVHT Travel-Time (minutes) Delay (veh-hrs) Pre-Timed SWARM % Change VMTVHT Travel-Time (minutes) Delay (veh-hrs) Pre-Timed65,8711, SWARM66,4261, % Change0.8%6.0%5.1%34.7% 10/05 Pre-timed, 12/05 SWARM (Preliminary) 6/06 Pre-timed and SWARM")
14
Task 4: Draft Reporting Format On-ramp queue storage/spillover On-ramp queue storage/spillover Measurement challenges Measurement challenges Communications failures Communications failures Incorporate incidents, weather Incorporate incidents, weather 2006 incident data will be in Portal soon 2006 incident data will be in Portal soon Focus on gaps in ATMS analysis capabilities? Focus on gaps in ATMS analysis capabilities? Need to understand what those are Need to understand what those are

15
Task 5: Regional Corridor Study Candidates previously identified Candidates previously identified OR-217 Southbound OR-217 Southbound I-205 Northbound I-205 Northbound I-5 Lower Northbound I-5 Lower Northbound I-205 Southbound I-205 Southbound Issues Issues Communication Failures Communication Failures On-ramps – measurement of spillover, total delay On-ramps – measurement of spillover, total delay Off-ramp counts (needs further discussion) Off-ramp counts (needs further discussion)
 Off-ramp counts (needs further discussion)")
16
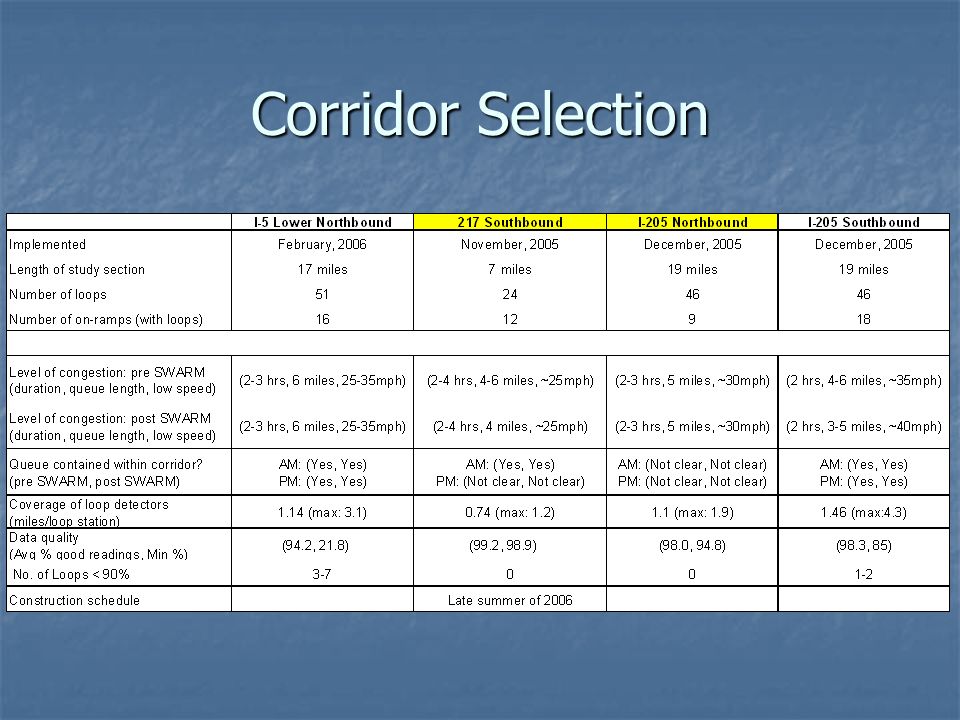
Corridor Selection I-205 NB I-205 NB I-5 Lower NB I-5 Lower NB I-205 SB I-205 SB

17
Corridor Selection

19
Questions Communication issues status Communication issues status OR-217 OR-217 OR-217 Construction OR-217 Construction Gather pre-timed data before SWARM is reactivated? Gather pre-timed data before SWARM is reactivated? I-205 NB I-205 NB Glisan Street detectors? Glisan Street detectors? Downstream of Division bottleneck Downstream of Division bottleneck

20
Other Items Possible partnership w/Caltrans Possible partnership w/Caltrans Capturing additional operational data from SWARM? Capturing additional operational data from SWARM? Contacts with NET (Delcan)? Contacts with NET (Delcan)? Project staffing Project staffing OTREC proposal for UTC funding component of project OTREC proposal for UTC funding component of project Subcontract to ASU Subcontract to ASU
. Contacts with NET (Delcan). Project staffing Project staffing OTREC proposal for UTC funding component of project OTREC proposal for UTC funding component of project Subcontract to ASU Subcontract to ASU.")
21
Next Steps December December Complete literature review Complete literature review Complete work on data processing tools Complete work on data processing tools Incorporate new data fidelity flags Incorporate new data fidelity flags 2005 Data Analysis 2005 Data Analysis Complete TRB poster Complete TRB poster January January TRB paper presentation TRB paper presentation TBD TBD Preliminary analysis for regional study Preliminary analysis for regional study

22
Next Steps (from 7/06 meeting, for reference) Reasons for the increase in delay Reasons for the increase in delay More analysis on on-ramps More analysis on on-ramps Total delay? – require counts at meters Total delay? – require counts at meters Travel time (sampling frequency) Travel time (sampling frequency) Report Report
 Travel time (sampling frequency) Report Report.")
23
Recommendations (from 7/06, for reference) Data near bottleneck to measure bottleneck discharge flow Data near bottleneck to measure bottleneck discharge flow Video? Video? Agree on performance measure for on-ramps Agree on performance measure for on-ramps Total delay, queue length, queue spill-over Total delay, queue length, queue spill-over All or selected on-ramps All or selected on-ramps Data collection method for on-ramps Data collection method for on-ramps Video: time-consuming for total delay Video: time-consuming for total delay

Similar presentations


 System Task 4: Pilot Study July 31, 2006 Robert Bertini.>")


 Project Terry Klim, P.E. Kevin Fehon, P.E. DKS Associates D.>")