Download presentation
Presentation is loading. Please wait.

1
Region 6 White-headed Woodpecker Monitoring 2011

2
Monitoring Strategy Cooperators
USFS Pacific Northwest Region Oregon / Washington Klamath Bird Observatory Ecology Program has supporting role in this region-wide project

3
Overview WHWO Life History & Importance Project Overview
& Questions Asked Ecology Program Role Protocols & Review of First Field Season

4
Summary of Existing Knowledge
May be one of the least studied woodpeckers Life History Food Habits Range and Distribution Population Trends Habitat Use Ecological Considerations

5
Life History Year-round residents Monogamous Cavity nesting birds
Produce single clutch per year of 4-5 eggs Both parents brood and feed young Fledge in 26 days, usually late June-early July Home range averages about 800 acres Reported reproductive success ranges from 23 to 85% (Frenzel, Kozma, Forristal) Adult survival estimated at 65% (Frenzel) Nest success tied to presence of large pine (Hollenbeck et al. 2009)
 Adult survival estimated at 65% (Frenzel) Nest success tied to presence of large pine (Hollenbeck et al. 2009)")
6
Food Habits Primarily forage on live trees, rarely on snags
Feed on insects from May to September – ants, beetles, cicadas Feed on ponderosa or sugar pine seeds from late summer through the winter Occasionally sapsuck in early spring Frequently drink water

7
Biology and Habitat Use
White-headed woodpeckers (WHWO) are strongly associated with open, dry ponderosa pine forest habitat. Historically, fire maintained open habitat for this species. Generally considered old-growth associates, but Kozma (Yakama Nation) has recently found that they may be using younger forests as well. Also associated with post-fire habitat. They occur in higher densities and/or reproduce more successfully in post-fire habitat than in other habitats. WHWO is associated with mixed severity burn areas. WHWO use large snags (primarily ponderosa pine) for nesting and roosting. WHWO feed almost exclusively on ponderosa and sugar pine seeds during fall and winter, and mature pine produce a more reliable seed crop.
 are strongly associated with open, dry ponderosa pine forest habitat. Historically, fire maintained open habitat for this species. Generally considered old-growth associates, but Kozma (Yakama Nation) has recently found that they may be using younger forests as well. Also associated with post-fire habitat. They occur in higher densities and/or reproduce more successfully in post-fire habitat than in other habitats. WHWO is associated with mixed severity burn areas. WHWO use large snags (primarily ponderosa pine) for nesting and roosting. WHWO feed almost exclusively on ponderosa and sugar pine seeds during fall and winter, and mature pine produce a more reliable seed crop.")
8
Other Woodpeckers Along Transects
A number of other species observed as well: Pileated Woodpecker Requires highly decomposed wood, ants Hairy Woodpecker More likely to drill for food Williamson’s Sapsucker Eats sap, phloem, ants Northern Flicker Ground foraging Black-backed Woodpecker Post-stand replacement Lewis’ Woodpecker Flycatching of aerial insects

9
Range and Distribution
British Columbia – very rare Idaho – scarce and patchy distribution Washington – rare E and NE Oregon – uncommon SW Oregon - scarce and patchy distribution California – common in Sierras S California – different subspecies P. a. gravirostras - common From Garret et al. 1996

10
Habitat Use General Habitat Description:
Ponderosa pine or dry mixed conifer forests dominated by ponderosa pine and/or sugar pine and Douglas-fir Large mature pines Nest in open forests with sparse understory vegetation Burned forest – in areas with 60% low severity or unburned (Wightman and Saab 2008) High interspersion/juxtaposition of open and closed ponderosa pine forest patches (Hollenbeck et al. 2009) 71% of landscape with < 40% canopy closure (Wightman and Saab 2008)
 High interspersion/juxtaposition of open and closed ponderosa pine forest patches (Hollenbeck et al. 2009) 71% of landscape with < 40% canopy closure (Wightman and Saab 2008)")
11
Habitat Use Nesting Habitat:
Stands with <40% canopy closure, often in openings created by silvicultural treatments or fire Slopes < 20% and lower slope positions Nest sites w/ >=12 large pines (>21”dbh) had highest nest success (Frenzel) Nest Tree Characteristics Kozma 2009 Frenzel 2004 Dixon 1995 Buchanan et al. 2003 Bull 1980 Cannon (unpub. data) Nest dbh (cm) 36.6 68.9 65.0 51.5 45 100 Nest height (m) 3.8 3.6 5 5.8 3 2.2 Decay moderate to decayed 71% moderate moderate to hard soft Tree species 80.6 % ponderosa pine ponderosa pine 84% ponderosa pine 76% ponderosa pine 75% ponderosa pine Douglas-fir Sample size 36 405 43 21 4 1 Study location south-central Washington central and south-central Oregon central and south-central Oregon eastern Cascades Washington northeast Oregon southwest Oregon
 had highest nest success (Frenzel) Nest Tree Characteristics. Kozma Frenzel Dixon Buchanan et al Bull Cannon (unpub. data) Nest dbh (cm) Nest height (m) Decay. moderate to decayed. 71% moderate. moderate to hard. soft. Tree species % ponderosa pine. ponderosa pine. 84% ponderosa pine. 76% ponderosa pine. 75% ponderosa pine. Douglas-fir. Sample size Study location. south-central Washington. central and south-central. Oregon. central and south-central Oregon. eastern Cascades Washington. northeast Oregon. southwest Oregon.")
12
Habitat Use Roosting Habitat (Dixon 1995):
Most roosts in multi-layerd stands Higher canopy closure, average 57% Higher density of large live trees (avg. 16/acre) than nest sites Foraging Habitat (Dixon 1995): Foraging stands averaged 65% canopy closure Forage primarily in live large ponderosa pine trees Sapsucking occurred in dense stands of smaller trees
 than nest sites. Foraging Habitat (Dixon 1995): Foraging stands averaged 65% canopy closure. Forage primarily in live large ponderosa pine trees. Sapsucking occurred in dense stands of smaller trees.")
13
Population Trends Breeding Bird Survey trends :
Stable to increasing range-wide Washington and Oregon – trends not significant and credibility measure was “very imprecise” – 3-5% per year change would not be detected Population declines and range reductions: Central Oregon – comparison of density estimates between Dixon (1995) and Frenzel and Popper (1998) indicate a 20% decline in the density of WHWO in about 5 years Central Oregon, reproductive success of WHWO has been too low to offset adult mortality, thus the population is declining to the point that occupancy of known territories steadily decreased over a 6 year study period (Frenzel 2004) WHWO no longer occur at some sites in the northern Blue Mountains where they used to be relatively common (Bull 1980 and Nielsen-Pincus 2005)
 and Frenzel and Popper (1998) indicate a 20% decline in the density of WHWO in about 5 years. Central Oregon, reproductive success of WHWO has been too low to offset adult mortality, thus the population is declining to the point that occupancy of known territories steadily decreased over a 6 year study period (Frenzel 2004) WHWO no longer occur at some sites in the northern Blue Mountains where they used to be relatively common (Bull 1980 and Nielsen-Pincus 2005)")
14
Management Concerns Management Indicator Species, Regional Forester’s Sensitive Species, BLM Special Status Species, and a species of concern in Forest Plan Revisions Forest management concerns: Fires create habitat and thus help to restore habitat for this species. Salvage can reduce snag densities to levels which eliminate “restored” habitat Dry forest habitat is the target of most restoration and fuels reduction projects that have the potential to either have beneficial or negative effects on habitat: Create open habitat Reduce risk of loss of large pine habitat However - especially important is the potential loss of large ponderosa pine trees and snags due to prescribed fire.

15
Threats to WHWO #1 - Habitat loss

16
Causes of Decline: Late-seral, single-story, Ponderosa Pine Forests
81 percent decline from historical conditions basin-wide Timber harvest: Replaced late-seral forests with mid-seral forests Harvest of large ponderosa pine Fire exclusion: Shift to more shade-tolerant species Douglas-fir and white/grand fir Shift to multi-storied, dense stands

17
Threats to WHWO Predators
A main cause of nest failure appears to be predation by small mammals (Frenzel 2004) Increase in shrub cover and down wood cover increases nest predator populations (Smith and Maguire 2004) Golden mantled ground squirrel - survival and densities higher in areas with higher down wood volume Yellow-pine chipmunk - densities are Higher where there is greater total shrub and live bitterbrush cover
 Increase in shrub cover and down wood cover increases nest predator populations (Smith and Maguire 2004) Golden mantled ground squirrel. - survival and densities higher in areas with higher down wood volume. Yellow-pine chipmunk - densities are. Higher where there is greater total. shrub and live bitterbrush cover.")
18
Other factors affecting WHWO
Disease – loss of white pine and sugar pine – alternate food for white-headed woodpeckers Competition for nest sites Harvest units as ecological traps? Increased road density results in increased loss of snags

19
Conservation Assessment for White-headed Woodpecker
Regional Goals: Summarize existing knowledge Identify important information gaps and uncertainties Define and map habitat Identify population and habitat core areas Offer management considerations to better manage the species Develop a monitoring strategy

20
Monitoring Strategy Monitoring & Research Approach
Broad-scale occupancy monitoring - designed to provide reliable, standardized data on the distribution, site occupancy, and population trends for white-headed woodpeckers across their range in OR and WA. Treatment effectiveness monitoring – designed to assess effect of stand-level treatments on woodpecker occupancy and nest survival. Validation monitoring – designed to validate & refine habitat suitability models of nesting white-headed woodpeckers in burned and unburned forests. Fuels data collection – designed to support modeling of fire-climate impacts on historic and future habitat suitability

21
Gather existing location data on WHWO
White-headed woodpecker locations in Oregon and Washington Sources: FS NRIS Wildlife BLM GEOBOB Natural Heritage EBird Database Saab – Birds & Burns Kozma Frenzel

22
Mapping white-headed woodpecker habitat
Nesting Habitat Mapping Criteria Based on GNN data Basic Habitat Type: Ponderosa pine, sugar pine, western white pine dominated Green forests Canopy cover: >=10% and < 40% Large trees: 8 pines/acre >= 21 inches Post-fire Habitat Type: Ponderosa pine, sugar pine, western white pine Pre-fire canopy cover: >=10% and < 40% Large trees: 8 pines (live or dead)/acre >= 21 inches Fire severity: low severity only Age of fire: fires since 2000
/acre >= 21 inches. Fire severity: low severity only. Age of fire: fires since")
23
Monitoring Strategy Regional broad-scale occupancy and distribution monitoring 30 transects through region Play-back survey at point count stations 2,700 m random transects w/ 10 point counts each Transects within pine-dominated landscapes

24
Monitoring Strategy More intensive study areas
Similar protocol, but more intensive 2 field crews managed by Vicki Saab Pringle Falls Chemult

25
Monitoring Strategy This broad-scale monitoring strategy was designed to answer the following questions at a Regional scale: What are the spatial distribution and occupancy rates of white-headed woodpecker across the dry forest landscape? What are trends in distribution and occupancy? What key habitat characteristics are associated with dry forest species? This information will be used to refine habitat associations and treatment prescriptions (e.g., canopy closure, live tree and snag density, and tree size)
")
26
Ecology Program Involvement
Ecology Program has supporting role in this region-wide project Transect establishment and data collection Area 4 (Central Oregon) was responsible for installing 12 permanent transects in 2011 NE Oregon and Eastern Washington also have transects Currently intend to revisit transects for 6 years Woodpecker callbacks were conducted at all 12 transects in 2011 Vegetation measurements were done on 4 transects in 2011 Vicki Saab and Kim Mellen-McLean are managing and analyzing data
 was responsible for installing 12 permanent transects in NE Oregon and Eastern Washington also have transects. Currently intend to revisit transects for 6 years. Woodpecker callbacks were conducted at all 12 transects in Vegetation measurements were done on 4 transects in Vicki Saab and Kim Mellen-McLean are managing and analyzing data.")
27
Monitoring Strategy Woodpecker Callbacks In Central Oregon
12 transects 10 points per transect 2 visits per point between April 20-July 7 4.5 minutes 2 people

28
Monitoring Strategy Woodpecker Callbacks Issues Transect establishment
Time sensitive Weather dependent Road closures Long distances between transects Long days

29
Monitoring Strategy

31
Monitoring Strategy Playbacks Vegetation 2 people 2 months 5 min/point
Original estimate was 1 week per transect for 2 people Highly variable depending on point Avg would be 1 week for 4 people Thanks Amy and Nikola!

32
Monitoring Strategy Vegetation 1/3 of the transects each year
Trees, saplings, seedlings, snags, stumps, shrub cover, DWD, biomass estimates, litter and duff depths

33
Monitoring Strategy Vegetation Data Collection
Bird and Burns methodology

34
Monitoring Strategy Vegetation Data Collection
Bird and Burns methodology Trees 2,6,20m belts DBH, ht, crown ht Snags 2,20m belts DBH, ht Down wood Along each transect Saplings 2 4m radius circles Litter depth Photoloads Ends of transects 1 & 3

35
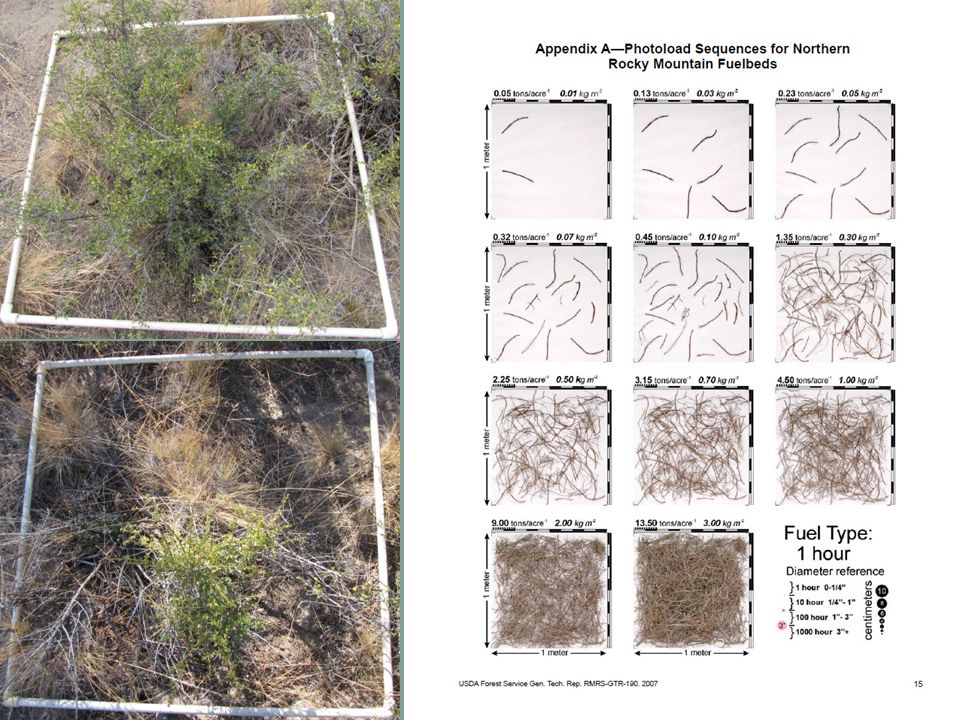
Monitoring Strategy Photoload sampling technique (Keane and Dickinson 2007)
")
36
Monitoring Strategy Fuels data collection
Designed to support modeling of fire-climate impacts on historic and future habitat suitability Part of RMRS FireBGC v2 simulation modeling project Estimate modern fuel loading using photoload sampling technique (Keane and Dickinson 2007): Woody, shrub, herbaceous fuel loadings Duff and litter fuel loading Canopy base height and tree height
: Woody, shrub, herbaceous fuel loadings. Duff and litter fuel loading. Canopy base height and tree height.")
39
Results?

Similar presentations